
Advertisement
BAWAG Group (VIE:BG) jumps 3.2% this week, though earnings growth is still tracking behind five-year shareholder returns

Stock pickers are generally looking for stocks that will outperform the broader market. And the truth is, you can make significant gains if you buy good quality businesses at the right price. For example, the BAWAG Group AG (VIE:BG) share price is up 60% in the last 5 years, clearly besting the market return of around 20% (ignoring dividends). On the other hand, the more recent gains haven't been so impressive, with shareholders gaining just 51%, including dividends.
Since the stock has added €141m to its market cap in the past week alone, let's see if underlying performance has been driving long-term returns.
View our latest analysis for BAWAG Group
While markets are a powerful pricing mechanism, share prices reflect investor sentiment, not just underlying business performance. One way to examine how market sentiment has changed over time is to look at the interaction between a company's share price and its earnings per share (EPS).
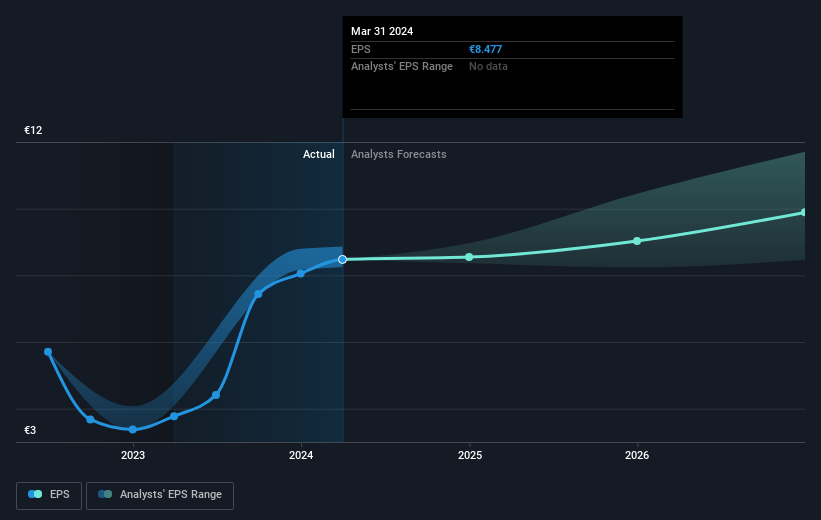
Over half a decade, BAWAG Group managed to grow its earnings per share at 15% a year. This EPS growth is higher than the 10% average annual increase in the share price. So one could conclude that the broader market has become more cautious towards the stock. This cautious sentiment is reflected in its (fairly low) P/E ratio of 6.73.
The graphic below depicts how EPS has changed over time (unveil the exact values by clicking on the image).
We know that BAWAG Group has improved its bottom line over the last three years, but what does the future have in store? This free interactive report on BAWAG Group's balance sheet strength is a great place to start, if you want to investigate the stock further.
What About Dividends?
As well as measuring the share price return, investors should also consider the total shareholder return (TSR). The TSR incorporates the value of any spin-offs or discounted capital raisings, along with any dividends, based on the assumption that the dividends are reinvested. It's fair to say that the TSR gives a more complete picture for stocks that pay a dividend. As it happens, BAWAG Group's TSR for the last 5 years was 123%, which exceeds the share price return mentioned earlier. And there's no prize for guessing that the dividend payments largely explain the divergence!
A Different Perspective
We're pleased to report that BAWAG Group shareholders have received a total shareholder return of 51% over one year. That's including the dividend. That gain is better than the annual TSR over five years, which is 17%. Therefore it seems like sentiment around the company has been positive lately. Given the share price momentum remains strong, it might be worth taking a closer look at the stock, lest you miss an opportunity. I find it very interesting to look at share price over the long term as a proxy for business performance. But to truly gain insight, we need to consider other information, too. Even so, be aware that BAWAG Group is showing 2 warning signs in our investment analysis , and 1 of those is a bit unpleasant...
For those who like to find winning investments this free list of undervalued companies with recent insider purchasing, could be just the ticket.
Please note, the market returns quoted in this article reflect the market weighted average returns of stocks that currently trade on Austrian exchanges.
Valuation is complex, but we're here to simplify it.
Discover if BAWAG Group might be undervalued or overvalued with our detailed analysis, featuring fair value estimates, potential risks, dividends, insider trades, and its financial condition.
Access Free AnalysisHave feedback on this article? Concerned about the content? Get in touch with us directly. Alternatively, email editorial-team (at) simplywallst.com.
This article by Simply Wall St is general in nature. We provide commentary based on historical data and analyst forecasts only using an unbiased methodology and our articles are not intended to be financial advice. It does not constitute a recommendation to buy or sell any stock, and does not take account of your objectives, or your financial situation. We aim to bring you long-term focused analysis driven by fundamental data. Note that our analysis may not factor in the latest price-sensitive company announcements or qualitative material. Simply Wall St has no position in any stocks mentioned.
Have feedback on this article? Concerned about the content? Get in touch with us directly. Alternatively, email editorial-team@simplywallst.com
About WBAG:BG
Excellent balance sheet with reasonable growth potential and pays a dividend.
Market Insights

Advertisement
Community Narratives
WhiteCap Is Positioned To Profit Regardless Of Trump's Policy 
Fair Value CA$22.60|61.6% undervalued
ST
Equity Analyst and Writer
Microsoft's Evolution Will Drive Revenue to New Heights Fueled by AI
Fair Value US$360.00|28.3% overvalued
BR
Community Contributor
A CASE FOR USD$2.50 (CAD$3.44) BY 2028 (A 5-10 BAGGER)
Fair Value CA$3.44|87.8% undervalued
AG
Community Contributor