- United Arab Emirates
- /
- Insurance
- /
- DFM:AMAN
Subdued Growth No Barrier To Dubai Islamic Insurance & Reinsurance Co. (Aman) (P.J.S.C)'s (DFM:AMAN) Price


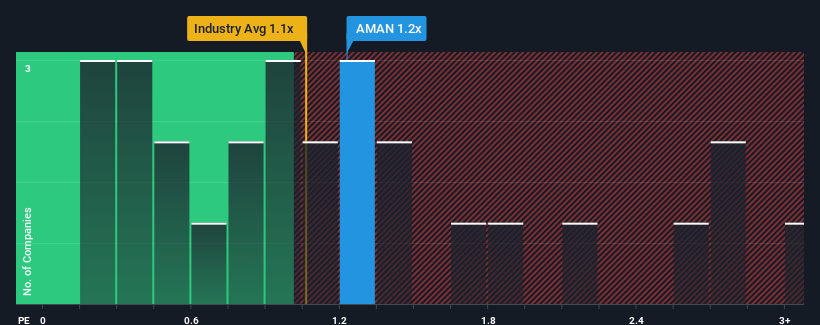
It's not a stretch to say that Dubai Islamic Insurance & Reinsurance Co. (Aman) (P.J.S.C)'s (DFM:AMAN) price-to-sales (or "P/S") ratio of 1.2x right now seems quite "middle-of-the-road" for companies in the Insurance industry in the United Arab Emirates, where the median P/S ratio is around 1.1x. While this might not raise any eyebrows, if the P/S ratio is not justified investors could be missing out on a potential opportunity or ignoring looming disappointment.
View our latest analysis for Dubai Islamic Insurance & Reinsurance (Aman) (P.J.S.C)
What Does Dubai Islamic Insurance & Reinsurance (Aman) (P.J.S.C)'s P/S Mean For Shareholders?
As an illustration, revenue has deteriorated at Dubai Islamic Insurance & Reinsurance (Aman) (P.J.S.C) over the last year, which is not ideal at all. Perhaps investors believe the recent revenue performance is enough to keep in line with the industry, which is keeping the P/S from dropping off. If not, then existing shareholders may be a little nervous about the viability of the share price.
Want the full picture on earnings, revenue and cash flow for the company? Then our free report on Dubai Islamic Insurance & Reinsurance (Aman) (P.J.S.C) will help you shine a light on its historical performance.Do Revenue Forecasts Match The P/S Ratio?
There's an inherent assumption that a company should be matching the industry for P/S ratios like Dubai Islamic Insurance & Reinsurance (Aman) (P.J.S.C)'s to be considered reasonable.
Taking a look back first, the company's revenue growth last year wasn't something to get excited about as it posted a disappointing decline of 4.2%. The last three years don't look nice either as the company has shrunk revenue by 24% in aggregate. So unfortunately, we have to acknowledge that the company has not done a great job of growing revenue over that time.
This is in contrast to the rest of the industry, which is expected to decline by 0.8% over the next year, or less than the company's recent medium-term annualised revenue decline.
In light of this, it's somewhat peculiar that Dubai Islamic Insurance & Reinsurance (Aman) (P.J.S.C)'s P/S sits in line with the majority of other companies. In general, when revenue shrink rapidly the P/S often shrinks too, which could set up shareholders for future disappointment. There's potential for the P/S to fall to lower levels if the company doesn't improve its top-line growth, which would be difficult to do with the current industry outlook.
What We Can Learn From Dubai Islamic Insurance & Reinsurance (Aman) (P.J.S.C)'s P/S?
It's argued the price-to-sales ratio is an inferior measure of value within certain industries, but it can be a powerful business sentiment indicator.
We've established that Dubai Islamic Insurance & Reinsurance (Aman) (P.J.S.C) currently trades on a higher than expected P/S since its recent three-year revenues are even worse than the forecasts for a struggling industry. When we see below average revenue, we suspect the share price is at risk of declining, sending the moderate P/S lower. We're also cautious about the company's ability to stay its recent medium-term course and resist even greater pain to its business from the broader industry turmoil. This would place shareholders' investments at risk and potential investors in danger of paying an unnecessary premium.
Before you settle on your opinion, we've discovered 3 warning signs for Dubai Islamic Insurance & Reinsurance (Aman) (P.J.S.C) that you should be aware of.
If these risks are making you reconsider your opinion on Dubai Islamic Insurance & Reinsurance (Aman) (P.J.S.C), explore our interactive list of high quality stocks to get an idea of what else is out there.
New: Manage All Your Stock Portfolios in One Place
We've created the ultimate portfolio companion for stock investors, and it's free.
• Connect an unlimited number of Portfolios and see your total in one currency
• Be alerted to new Warning Signs or Risks via email or mobile
• Track the Fair Value of your stocks
Have feedback on this article? Concerned about the content? Get in touch with us directly. Alternatively, email editorial-team (at) simplywallst.com.
This article by Simply Wall St is general in nature. We provide commentary based on historical data and analyst forecasts only using an unbiased methodology and our articles are not intended to be financial advice. It does not constitute a recommendation to buy or sell any stock, and does not take account of your objectives, or your financial situation. We aim to bring you long-term focused analysis driven by fundamental data. Note that our analysis may not factor in the latest price-sensitive company announcements or qualitative material. Simply Wall St has no position in any stocks mentioned.
About DFM:AMAN
Dubai Islamic Insurance & Reinsurance (Aman) (P.J.S.C)
Dubai Islamic Insurance & Reinsurance Co.
Adequate balance sheet very low.

