
Advertisement
- United Arab Emirates
- /
- Insurance
- /
- ADX:HAYAH
Why We're Not Concerned Yet About HAYAH Insurance Company P.J.S.C.'s (ADX:HAYAH) 27% Share Price Plunge

Unfortunately for some shareholders, the HAYAH Insurance Company P.J.S.C. (ADX:HAYAH) share price has dived 27% in the last thirty days, prolonging recent pain. The recent drop has obliterated the annual return, with the share price now down 9.0% over that longer period.
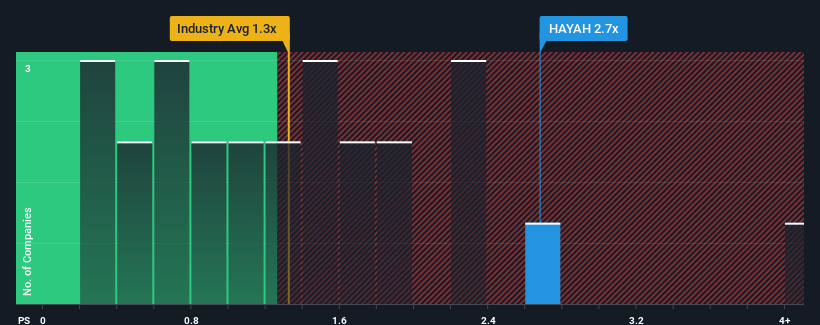
Even after such a large drop in price, you could still be forgiven for thinking HAYAH Insurance Company P.J.S.C is a stock not worth researching with a price-to-sales ratios (or "P/S") of 2.7x, considering almost half the companies in the United Arab Emirates' Insurance industry have P/S ratios below 1.3x. However, the P/S might be high for a reason and it requires further investigation to determine if it's justified.
See our latest analysis for HAYAH Insurance Company P.J.S.C
What Does HAYAH Insurance Company P.J.S.C's Recent Performance Look Like?
The recent revenue growth at HAYAH Insurance Company P.J.S.C would have to be considered satisfactory if not spectacular. One possibility is that the P/S ratio is high because investors think this good revenue growth will be enough to outperform the broader industry in the near future. However, if this isn't the case, investors might get caught out paying too much for the stock.
Want the full picture on earnings, revenue and cash flow for the company? Then our free report on HAYAH Insurance Company P.J.S.C will help you shine a light on its historical performance.How Is HAYAH Insurance Company P.J.S.C's Revenue Growth Trending?
In order to justify its P/S ratio, HAYAH Insurance Company P.J.S.C would need to produce impressive growth in excess of the industry.
If we review the last year of revenue growth, the company posted a worthy increase of 6.0%. The latest three year period has also seen an excellent 73% overall rise in revenue, aided somewhat by its short-term performance. Accordingly, shareholders would have definitely welcomed those medium-term rates of revenue growth.
Weighing the recent medium-term upward revenue trajectory against the broader industry's one-year forecast for contraction of 14% shows it's a great look while it lasts.
With this information, we can see why HAYAH Insurance Company P.J.S.C is trading at a high P/S compared to the industry. Presumably shareholders aren't keen to offload something they believe will continue to outmanoeuvre the industry. However, its current revenue trajectory will be very difficult to maintain against the headwinds other companies are facing at the moment.
The Final Word
Despite the recent share price weakness, HAYAH Insurance Company P.J.S.C's P/S remains higher than most other companies in the industry. We'd say the price-to-sales ratio's power isn't primarily as a valuation instrument but rather to gauge current investor sentiment and future expectations.
We see that HAYAH Insurance Company P.J.S.C justifiably maintains its high P/S on the merits of its recentthree-year revenue growth beating forecasts amidst struggling industry. It could be said that investors feel this revenue growth will continue into the future, justifying a higher P/S ratio. We still remain cautious about the company's ability to stay its recent course and swim against the current of the broader industry turmoil. Otherwise, it's hard to see the share price falling strongly in the near future if its revenue performance persists.
You need to take note of risks, for example - HAYAH Insurance Company P.J.S.C has 2 warning signs (and 1 which is concerning) we think you should know about.
If these risks are making you reconsider your opinion on HAYAH Insurance Company P.J.S.C, explore our interactive list of high quality stocks to get an idea of what else is out there.
Valuation is complex, but we're here to simplify it.
Discover if HAYAH Insurance Company P.J.S.C might be undervalued or overvalued with our detailed analysis, featuring fair value estimates, potential risks, dividends, insider trades, and its financial condition.
Access Free AnalysisHave feedback on this article? Concerned about the content? Get in touch with us directly. Alternatively, email editorial-team (at) simplywallst.com.
This article by Simply Wall St is general in nature. We provide commentary based on historical data and analyst forecasts only using an unbiased methodology and our articles are not intended to be financial advice. It does not constitute a recommendation to buy or sell any stock, and does not take account of your objectives, or your financial situation. We aim to bring you long-term focused analysis driven by fundamental data. Note that our analysis may not factor in the latest price-sensitive company announcements or qualitative material. Simply Wall St has no position in any stocks mentioned.
About ADX:HAYAH
HAYAH Insurance Company P.J.S.C
Provides health and life insurance solutions in the United Arab Emirates and internationally.
Flawless balance sheet with acceptable track record.
Market Insights


Advertisement
Community Narratives
Nike's Direct-to-Consumer Focus Will Drive Future Growth
Fair Value US$87.90|18.2% undervalued
UN
Community Contributor
Novo Nordisk will dominate GLP-1 market with Ozempic and Wegovy growth
Fair Value US$89.59|12.1% undervalued
BE
Community Contributor
Rheinmetall could get 20-25% of EU-NATO 3%-GDP defence spending
Fair Value €7.57k|82.4% undervalued
NO
Community Contributor