
Advertisement
This article is written for those who want to get better at using price to earnings ratios (P/E ratios). We'll look at TFF Group's (EPA:TFF) P/E ratio and reflect on what it tells us about the company's share price. Looking at earnings over the last twelve months, TFF Group has a P/E ratio of 21.42. That is equivalent to an earnings yield of about 4.7%.
Check out our latest analysis for TFF Group
How Do You Calculate A P/E Ratio?
The formula for P/E is:
Price to Earnings Ratio = Share Price ÷ Earnings per Share (EPS)
Or for TFF Group:
P/E of 21.42 = €26.700 ÷ €1.246 (Based on the trailing twelve months to October 2019.)
(Note: the above calculation results may not be precise due to rounding.)
Is A High Price-to-Earnings Ratio Good?
A higher P/E ratio means that investors are paying a higher price for each €1 of company earnings. That isn't necessarily good or bad, but a high P/E implies relatively high expectations of what a company can achieve in the future.
Does TFF Group Have A Relatively High Or Low P/E For Its Industry?
We can get an indication of market expectations by looking at the P/E ratio. You can see in the image below that the average P/E (17.4) for companies in the packaging industry is lower than TFF Group's P/E.
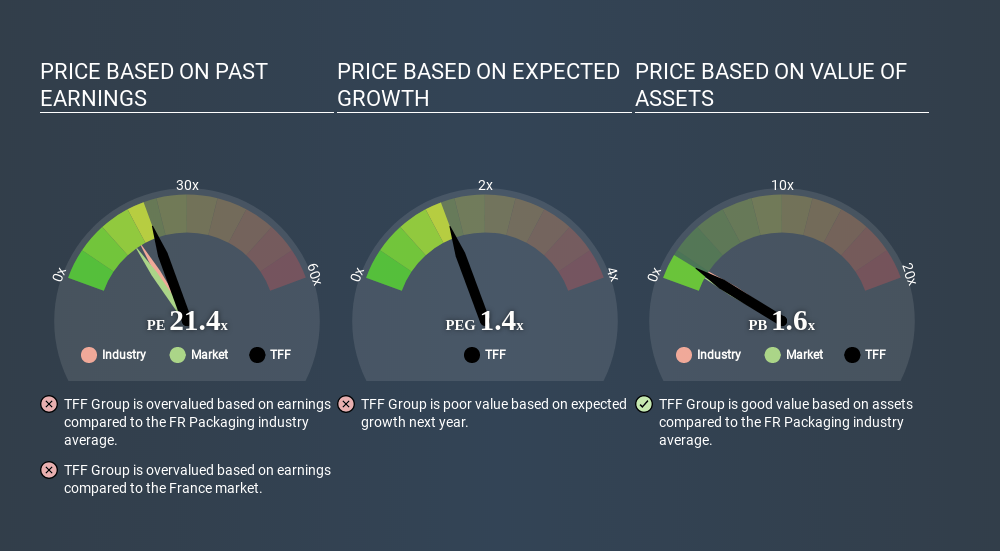
That means that the market expects TFF Group will outperform other companies in its industry. Shareholders are clearly optimistic, but the future is always uncertain. So investors should delve deeper. I like to check if company insiders have been buying or selling.
How Growth Rates Impact P/E Ratios
If earnings fall then in the future the 'E' will be lower. That means even if the current P/E is low, it will increase over time if the share price stays flat. A higher P/E should indicate the stock is expensive relative to others -- and that may encourage shareholders to sell.
TFF Group's earnings per share fell by 20% in the last twelve months. And it has shrunk its earnings per share by 1.3% per year over the last five years. This might lead to muted expectations.
A Limitation: P/E Ratios Ignore Debt and Cash In The Bank
It's important to note that the P/E ratio considers the market capitalization, not the enterprise value. Thus, the metric does not reflect cash or debt held by the company. In theory, a company can lower its future P/E ratio by using cash or debt to invest in growth.
While growth expenditure doesn't always pay off, the point is that it is a good option to have; but one that the P/E ratio ignores.
So What Does TFF Group's Balance Sheet Tell Us?
TFF Group's net debt is 25% of its market cap. This could bring some additional risk, and reduce the number of investment options for management; worth remembering if you compare its P/E to businesses without debt.
The Bottom Line On TFF Group's P/E Ratio
TFF Group has a P/E of 21.4. That's higher than the average in its market, which is 15.1. With a bit of debt, but a lack of recent growth, it's safe to say the market is expecting improved profit performance from the company, in the next few years.
Investors have an opportunity when market expectations about a stock are wrong. As value investor Benjamin Graham famously said, 'In the short run, the market is a voting machine but in the long run, it is a weighing machine. So this free visual report on analyst forecasts could hold the key to an excellent investment decision.
But note: TFF Group may not be the best stock to buy. So take a peek at this free list of interesting companies with strong recent earnings growth (and a P/E ratio below 20).
Love or hate this article? Concerned about the content? Get in touch with us directly. Alternatively, email editorial-team@simplywallst.com.
This article by Simply Wall St is general in nature. It does not constitute a recommendation to buy or sell any stock, and does not take account of your objectives, or your financial situation. We aim to bring you long-term focused analysis driven by fundamental data. Note that our analysis may not factor in the latest price-sensitive company announcements or qualitative material. Simply Wall St has no position in any stocks mentioned. Thank you for reading.
MI

The Foxhole
Nvidia's (NVDA) record profit had a US$7.8 billion catch. That chunk came from betting on its own customers, not from selling its chips.
96
JA

Jake_Merritt
The circularity worth examining is not the mark-to-market line. A large and growing share of Nvidia's revenue comes from companies funded by venture capital, and Nvidia participates in some of those rounds. That is the loop. The paper gains are just an accounting reflection of it, so focusing on them means arguing about the mirror rather than the room.
NA
nadia_y3d8i
Hyperscalers grew 13% sequentially, the other AI segment grew 25% and 138% year on year. The faster half is the funded half. AI venture funding was over 400 billion in the first half with about 70% spent on compute. That is an interesting composition shift like I mentioned yesterday.
 Mitchell Lawler
Market Insights
Which payment stocks actually get paid?

Every new payment app was supposed to kill Visa and Mastercard. Instead, they got bigger. So what does that mean for the payment stocks on your radar?
43
About ENXTPA:TFF
TFF Group
Engages in the wine and spirits ageing in the United States, Europe, France, Asia, and internationally.
Average dividend payer with slight risk.
Market Insights


Advertisement
Weekly Picks
RI


Rick_Orford on Starfighters Space ·
The 1960s Fighter Jet That Could Crack Open a $20 Billion Satellite Market
Fair Value:US$522.6% undervalued
72 followersusers have followed this narrative
4 commentsusers have commented on this narrative
12 likesusers have liked this narrative
TR


tripledub on Meta Platforms ·
The $135 Billion Bet That Should Make Every Shareholder Nervous
Fair Value:US$5861.7% undervalued
57 followersusers have followed this narrative
3 commentsusers have commented on this narrative
34 likesusers have liked this narrative
TA


Talos on Voyager Technologies ·
The "Landlord of Orbit" – A Deep Value Play Ahead of the Starlab Era
Fair Value:US$385.291.0% undervalued
54 followersusers have followed this narrative
0 commentsusers have commented on this narrative
5 likesusers have liked this narrative
IV

Ivoed on Uber Technologies ·
Uber’s Valuation Depends On Who Captures The Economics Of Driverless Rides
Fair Value:US$11632.3% undervalued
12 followersusers have followed this narrative
0 commentsusers have commented on this narrative
3 likesusers have liked this narrative
Recently Updated Narratives
PA

Pad on Williamson Tea Kenya ·
Long Term Hold
Fair Value:KSh18616.0% undervalued
16 followersusers have followed this narrative
0 commentsusers have commented on this narrative
0 likesusers have liked this narrative
TR


TripleS on Domo ·
$4.84 in cash & $900 million of NOLs available in November.
Fair Value:US$852.8% undervalued
1 followerusers have followed this narrative
0 commentsusers have commented on this narrative
0 likesusers have liked this narrative
LU


LunaRodas on Malibu Boats ·
MBUU | Malibu Boats: What They Said vs. What They Did
Fair Value:US$33.520.5% undervalued
1 followerusers have followed this narrative
0 commentsusers have commented on this narrative
0 likesusers have liked this narrative
Popular Narratives
OS


oscargarcia on NVIDIA ·
The company that went from selling GPUs to gamers to becoming the AI arms dealer of the 21st century.
Fair Value:US$28025.1% undervalued
365 followersusers have followed this narrative
9 commentsusers have commented on this narrative
16 likesusers have liked this narrative
CU

CubanEros on Microsoft ·
A wonderful business at reasonable price.
Fair Value:US$419.9118.2% overvalued
212 followersusers have followed this narrative
0 commentsusers have commented on this narrative
9 likesusers have liked this narrative
KI

KiwiInvest on Amazon.com ·
Amazon's high growth, high tech segments propel its profits, while traditional segments plod along
Fair Value:US$475.0945.2% undervalued
236 followersusers have followed this narrative
1 commentusers have commented on this narrative
8 likesusers have liked this narrative


