Advertisement
- United States
- /
- Telecom Services and Carriers
- /
- NasdaqCM:SIFY
Why Sify Technologies Limited’s (NASDAQ:SIFY) Return On Capital Employed Is Impressive
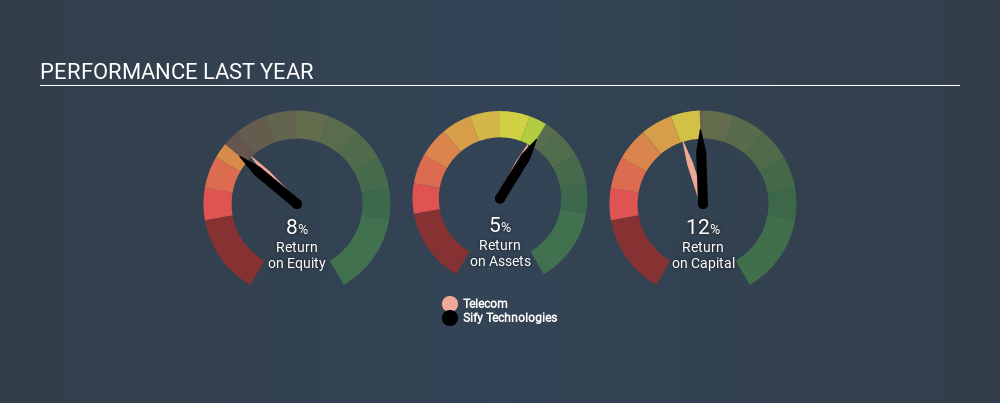
Today we'll evaluate Sify Technologies Limited (NASDAQ:SIFY) to determine whether it could have potential as an investment idea. Specifically, we'll consider its Return On Capital Employed (ROCE), since that will give us an insight into how efficiently the business can generate profits from the capital it requires.
Firstly, we'll go over how we calculate ROCE. Second, we'll look at its ROCE compared to similar companies. Finally, we'll look at how its current liabilities affect its ROCE.
Return On Capital Employed (ROCE): What is it?
ROCE is a metric for evaluating how much pre-tax income (in percentage terms) a company earns on the capital invested in its business. Generally speaking a higher ROCE is better. In brief, it is a useful tool, but it is not without drawbacks. Author Edwin Whiting says to be careful when comparing the ROCE of different businesses, since 'No two businesses are exactly alike.
How Do You Calculate Return On Capital Employed?
The formula for calculating the return on capital employed is:
Return on Capital Employed = Earnings Before Interest and Tax (EBIT) ÷ (Total Assets - Current Liabilities)
Or for Sify Technologies:
0.12 = ₹2.0b ÷ (₹32b - ₹15b) (Based on the trailing twelve months to December 2019.)
So, Sify Technologies has an ROCE of 12%.
See our latest analysis for Sify Technologies
Is Sify Technologies's ROCE Good?
One way to assess ROCE is to compare similar companies. In our analysis, Sify Technologies's ROCE is meaningfully higher than the 5.3% average in the Telecom industry. We would consider this a positive, as it suggests it is using capital more effectively than other similar companies. Separate from Sify Technologies's performance relative to its industry, its ROCE in absolute terms looks satisfactory, and it may be worth researching in more depth.
The image below shows how Sify Technologies's ROCE compares to its industry, and you can click it to see more detail on its past growth.
When considering this metric, keep in mind that it is backwards looking, and not necessarily predictive. Companies in cyclical industries can be difficult to understand using ROCE, as returns typically look high during boom times, and low during busts. ROCE is, after all, simply a snap shot of a single year. Future performance is what matters, and you can see analyst predictions in our free report on analyst forecasts for the company.
How Sify Technologies's Current Liabilities Impact Its ROCE
Liabilities, such as supplier bills and bank overdrafts, are referred to as current liabilities if they need to be paid within 12 months. Due to the way the ROCE equation works, having large bills due in the near term can make it look as though a company has less capital employed, and thus a higher ROCE than usual. To check the impact of this, we calculate if a company has high current liabilities relative to its total assets.
Sify Technologies has total assets of ₹32b and current liabilities of ₹15b. Therefore its current liabilities are equivalent to approximately 47% of its total assets. Sify Technologies has a middling amount of current liabilities, increasing its ROCE somewhat.
The Bottom Line On Sify Technologies's ROCE
With a decent ROCE, the company could be interesting, but remember that the level of current liabilities make the ROCE look better. Sify Technologies shapes up well under this analysis, but it is far from the only business delivering excellent numbers . You might also want to check this free collection of companies delivering excellent earnings growth.
If you like to buy stocks alongside management, then you might just love this free list of companies. (Hint: insiders have been buying them).
If you spot an error that warrants correction, please contact the editor at editorial-team@simplywallst.com. This article by Simply Wall St is general in nature. It does not constitute a recommendation to buy or sell any stock, and does not take account of your objectives, or your financial situation. Simply Wall St has no position in the stocks mentioned.
We aim to bring you long-term focused research analysis driven by fundamental data. Note that our analysis may not factor in the latest price-sensitive company announcements or qualitative material. Thank you for reading.
About NasdaqCM:SIFY
Sify Technologies
Offers information and communication technology solutions and services in India and internationally.
High growth potential and overvalued.
Similar Companies
Market Insights


Advertisement
Weekly Picks
CE


Ceazar on Sparc AI ·
When GPS fails: this small cap is fixing a $54B drone problem
Fair Value:US$3.8756.3% undervalued
13 followersusers have followed this narrative
0 commentsusers have commented on this narrative
3 likesusers have liked this narrative
BL


BlackGoat on IREN ·
IREN's Bold Moves in Sustainable Bitcoin Mining & AI Data Centers
Fair Value:US$71.4852.5% undervalued
212 followersusers have followed this narrative
8 commentsusers have commented on this narrative
32 likesusers have liked this narrative
HE


HedgeY on Arm Holdings ·
The Architecture Layer of AI Computing - But Priced Like the Future Already Arrived?
Fair Value:US$43043.1% undervalued
18 followersusers have followed this narrative
1 commentusers have commented on this narrative
6 likesusers have liked this narrative
HI


Hidden_Rock_Capital on Fiserv ·
Temporary "perfect storm" leads to opportunity to buy financial services leader for less than 5x long-term earnings
Fair Value:US$119.9954.8% undervalued
25 followersusers have followed this narrative
0 commentsusers have commented on this narrative
9 likesusers have liked this narrative
Recently Updated Narratives
HE

Henrynuke03 on Nigerian Exchange Group ·
Future Growth Awaits NGXGROUP with New High-Profile Listings
Fair Value:₦221.1732.3% undervalued
7 followersusers have followed this narrative
0 commentsusers have commented on this narrative
0 likesusers have liked this narrative
PR


PrashhD on Aurionpro Solutions ·
Aurionpro Solutions: Is the Market Mispricing One of India's Most Interesting Fintech Product Companies?
Fair Value:₹1k27.1% undervalued
1 followerusers have followed this narrative
0 commentsusers have commented on this narrative
0 likesusers have liked this narrative
NE

newsfinder11221 on Lotus Technology ·
Lotus Technology: A Technology-Driven Luxury EV Brand with a Promising Turnaround Story
Fair Value:US$2.462.9% undervalued
1 followerusers have followed this narrative
2 commentsusers have commented on this narrative
0 likesusers have liked this narrative
Popular Narratives
CU

CubanEros on Microsoft ·
A wonderful business at reasonable price.
Fair Value:US$419.916.3% undervalued
95 followersusers have followed this narrative
0 commentsusers have commented on this narrative
7 likesusers have liked this narrative
OS


oscargarcia on NVIDIA ·
The company that went from selling GPUs to gamers to becoming the AI arms dealer of the 21st century.
Fair Value:US$28029.6% undervalued
209 followersusers have followed this narrative
9 commentsusers have commented on this narrative
15 likesusers have liked this narrative
BE

benjamin_lvieq on PayPal Holdings ·
PayPal: PayPal Doesn't Need to Grow – It Needs to Stop Falling – A Mispriced Cash Machine With a Cannibal Buyback
Fair Value:US$6510.3% undervalued
73 followersusers have followed this narrative
2 commentsusers have commented on this narrative
11 likesusers have liked this narrative
Trending Discussion
BL

Blegells on Terra Balcanica Resources ·
⏫42X THE AVERAGE DAILY TRADING VOLUME TODAY, JULY 28 🐂🐂🐂 FORTY-TWO!
1
|0
DE

derek_3wsdg on Teladoc Health ·
You’ve overlooked the activist investor factor. Travis Cocke’s Voss has announced 5% ownership through a 13G filing. They’ve added to that 5% since, and in doing so, have created a structural trap door for 27.42 Million Shares actively sold short. Chuck will announce lots of positives on July 29 but it’s what Voss announces shortly after that will rock the overextended Teledoc shorts. The Walmart partnership is the tip of the iceberg. The market is missing the sheer regulatory and enterprise friction of modern corporate healthcare. Teladoc isn't a "consumer app"; it is the primary digital infrastructure integrated directly into the legacy backends of Tier-1 insurance companies and fortune 500 employers, covering 105 million+ lives. Teladoc is acting as the digital top-of-funnel engine for the world's largest retailer. If Voss pushes the narrative that Teladoc is effectively the outsourced digital brain of Walmart's entire healthcare footprint, the fair value shifts from a basic health multiple to an enterprise distribution premium. Additionally , we are in a structural gold rush for high-quality, legally compliant, longitudinal medical data to train vertical healthcare AI models. Large technology hyperscalers and pharmaceutical giants cannot simply scrape the internet for this; they need structured clinical inputs. Teladoc sits on one of the largest de-identified virtual medical datasets on earth. From the activist playbook , we’ll see Voss demand the immediate creation of a Data & Diagnostics Licensing Division, transforming a legacy liability into an incredibly high-margin, pure-software data asset that requires zero human clinician hours to scale. Chuck is doing great work and deserves credi5 for the Teledoc turnaround but it will be Travis Cocke who will be responsible for a share price way beyond your $15 valuation.
1
|0
