
Advertisement
- Australia
- /
- Consumer Durables
- /
- ASX:FWD
What Type Of Returns Would Fleetwood's(ASX:FWD) Shareholders Have Earned If They Purchased Their SharesThree Years Ago?
For many investors, the main point of stock picking is to generate higher returns than the overall market. But the risk of stock picking is that you will likely buy under-performing companies. Unfortunately, that's been the case for longer term Fleetwood Corporation Limited (ASX:FWD) shareholders, since the share price is down 46% in the last three years, falling well short of the market return of around 20%. It's up 1.3% in the last seven days.
View our latest analysis for Fleetwood
In his essay The Superinvestors of Graham-and-Doddsville Warren Buffett described how share prices do not always rationally reflect the value of a business. One flawed but reasonable way to assess how sentiment around a company has changed is to compare the earnings per share (EPS) with the share price.
During five years of share price growth, Fleetwood moved from a loss to profitability. That would generally be considered a positive, so we are surprised to see the share price is down. So it's worth looking at other metrics to try to understand the share price move.
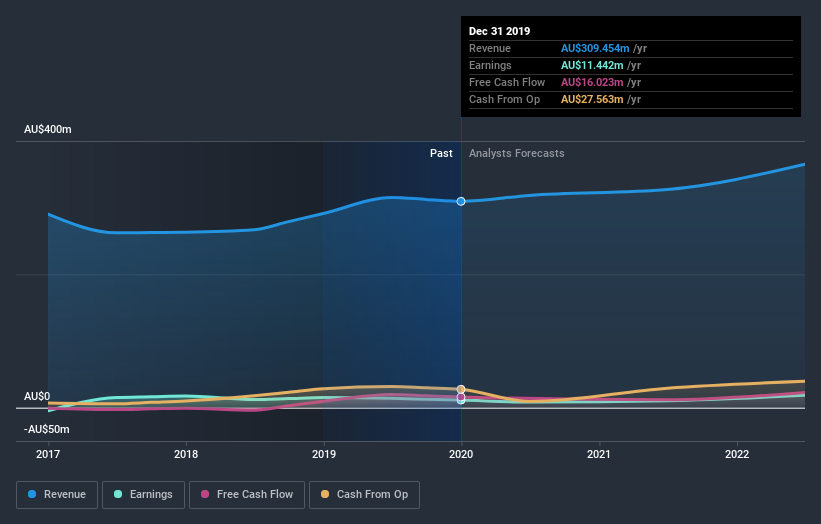
Revenue is actually up 5.6% over the three years, so the share price drop doesn't seem to hinge on revenue, either. It's probably worth investigating Fleetwood further; while we may be missing something on this analysis, there might also be an opportunity.
You can see how earnings and revenue have changed over time in the image below (click on the chart to see the exact values).
You can see how its balance sheet has strengthened (or weakened) over time in this free interactive graphic.
What about the Total Shareholder Return (TSR)?
We've already covered Fleetwood's share price action, but we should also mention its total shareholder return (TSR). The TSR attempts to capture the value of dividends (as if they were reinvested) as well as any spin-offs or discounted capital raisings offered to shareholders. Fleetwood's TSR of was a loss of 41% for the 3 years. That wasn't as bad as its share price return, because it has paid dividends.
A Different Perspective
While the broader market lost about 2.6% in the twelve months, Fleetwood shareholders did even worse, losing 4.7%. Having said that, it's inevitable that some stocks will be oversold in a falling market. The key is to keep your eyes on the fundamental developments. Regrettably, last year's performance caps off a bad run, with the shareholders facing a total loss of 2.5% per year over five years. We realise that Baron Rothschild has said investors should "buy when there is blood on the streets", but we caution that investors should first be sure they are buying a high quality business. Before spending more time on Fleetwood it might be wise to click here to see if insiders have been buying or selling shares.
For those who like to find winning investments this free list of growing companies with recent insider purchasing, could be just the ticket.
Please note, the market returns quoted in this article reflect the market weighted average returns of stocks that currently trade on AU exchanges.
If you decide to trade Fleetwood, use the lowest-cost* platform that is rated #1 Overall by Barron’s, Interactive Brokers. Trade stocks, options, futures, forex, bonds and funds on 135 markets, all from a single integrated account. Promoted
New: AI Stock Screener & Alerts
Our new AI Stock Screener scans the market every day to uncover opportunities.
• Dividend Powerhouses (3%+ Yield)
• Undervalued Small Caps with Insider Buying
• High growth Tech and AI Companies
Or build your own from over 50 metrics.
This article by Simply Wall St is general in nature. It does not constitute a recommendation to buy or sell any stock, and does not take account of your objectives, or your financial situation. We aim to bring you long-term focused analysis driven by fundamental data. Note that our analysis may not factor in the latest price-sensitive company announcements or qualitative material. Simply Wall St has no position in any stocks mentioned.
*Interactive Brokers Rated Lowest Cost Broker by StockBrokers.com Annual Online Review 2020
Have feedback on this article? Concerned about the content? Get in touch with us directly. Alternatively, email editorial-team@simplywallst.com.
About ASX:FWD
Fleetwood
Designs, manufactures, sells, and installs modular accommodation and buildings in Australia and New Zealand.
Flawless balance sheet and good value.
Similar Companies
Market Insights

Advertisement
Community Narratives
MicroVision will explode future revenue by 380.37% with a vision towards success
Fair Value US$60.00|98.5% undervalued
TH
Community Contributor
The Indispensable Artery for a New North American Economy
Fair Value CA$132.87|2.3% undervalued
TI
Community Contributor