Advertisement
- United Kingdom
- /
- Hospitality
- /
- LSE:GYM
UK Value Picks 3 Stocks Priced Below Estimated Worth

Simply Wall St
Reviewed by Simply Wall St
The United Kingdom's stock market has recently faced challenges, with the FTSE 100 and FTSE 250 indices experiencing declines amid weak trade data from China, impacting companies heavily reliant on global demand. In such an environment, identifying undervalued stocks becomes crucial as investors seek opportunities where market prices may not fully reflect a company's intrinsic worth.
Top 10 Undervalued Stocks Based On Cash Flows In The United Kingdom
| Name | Current Price | Fair Value (Est) | Discount (Est) |
| PageGroup (LSE:PAGE) | £2.27 | £4.44 | 48.9% |
| LSL Property Services (LSE:LSL) | £2.80 | £5.58 | 49.8% |
| Likewise Group (AIM:LIKE) | £0.28 | £0.53 | 46.8% |
| Kromek Group (AIM:KMK) | £0.0485 | £0.090 | 46.2% |
| Hollywood Bowl Group (LSE:BOWL) | £2.495 | £4.82 | 48.2% |
| Gym Group (LSE:GYM) | £1.478 | £2.90 | 49.1% |
| Gooch & Housego (AIM:GHH) | £5.50 | £10.82 | 49.1% |
| Burberry Group (LSE:BRBY) | £11.05 | £21.09 | 47.6% |
| AstraZeneca (LSE:AZN) | £117.94 | £223.39 | 47.2% |
| ACG Metals (LSE:ACG) | £9.20 | £17.32 | 46.9% |
Let's uncover some gems from our specialized screener.
ACG Metals (LSE:ACG)
Overview: ACG Metals Limited focuses on copper production in Europe and has a market cap of £199.26 million.
Operations: The company's revenue is primarily derived from its mining segment, which generated $57.75 million.
Estimated Discount To Fair Value: 46.9%
ACG Metals is trading at £9.2, significantly below its estimated fair value of £17.32, indicating potential undervaluation based on cash flows. The company forecasts robust revenue growth of 28.4% annually, surpassing the UK market average and expects to become profitable within three years with a high return on equity projected at 29%. Despite recent production challenges, ACG upgraded its annual production guidance due to operational improvements and strategic leadership changes enhancing future prospects.
- The growth report we've compiled suggests that ACG Metals' future prospects could be on the up.
- Get an in-depth perspective on ACG Metals' balance sheet by reading our health report here.

Dr. Martens (LSE:DOCS)
Overview: Dr. Martens plc is involved in the design, development, procurement, marketing, sale, and distribution of footwear and has a market cap of approximately £889.09 million.
Operations: The company's revenue is primarily generated from its footwear segment, amounting to £787.60 million.
Estimated Discount To Fair Value: 17.5%
Dr. Martens is trading at £0.92, below its estimated fair value of £1.11, suggesting potential undervaluation based on cash flows. The company's earnings are forecast to grow significantly at 46% annually, outpacing the UK market average. However, profit margins have declined from last year and the dividend yield of 2.77% is not well covered by earnings, raising sustainability concerns despite expected revenue growth surpassing the market's rate slightly at 4.2%.
- In light of our recent growth report, it seems possible that Dr. Martens' financial performance will exceed current levels.
- Click here to discover the nuances of Dr. Martens with our detailed financial health report.
Gym Group (LSE:GYM)
Overview: The Gym Group plc operates a network of gym facilities under the Gym Group brand name in the United Kingdom, with a market cap of £264.14 million.
Operations: The company's revenue is primarily derived from the provision of high-quality health and fitness facilities, amounting to £235.20 million.
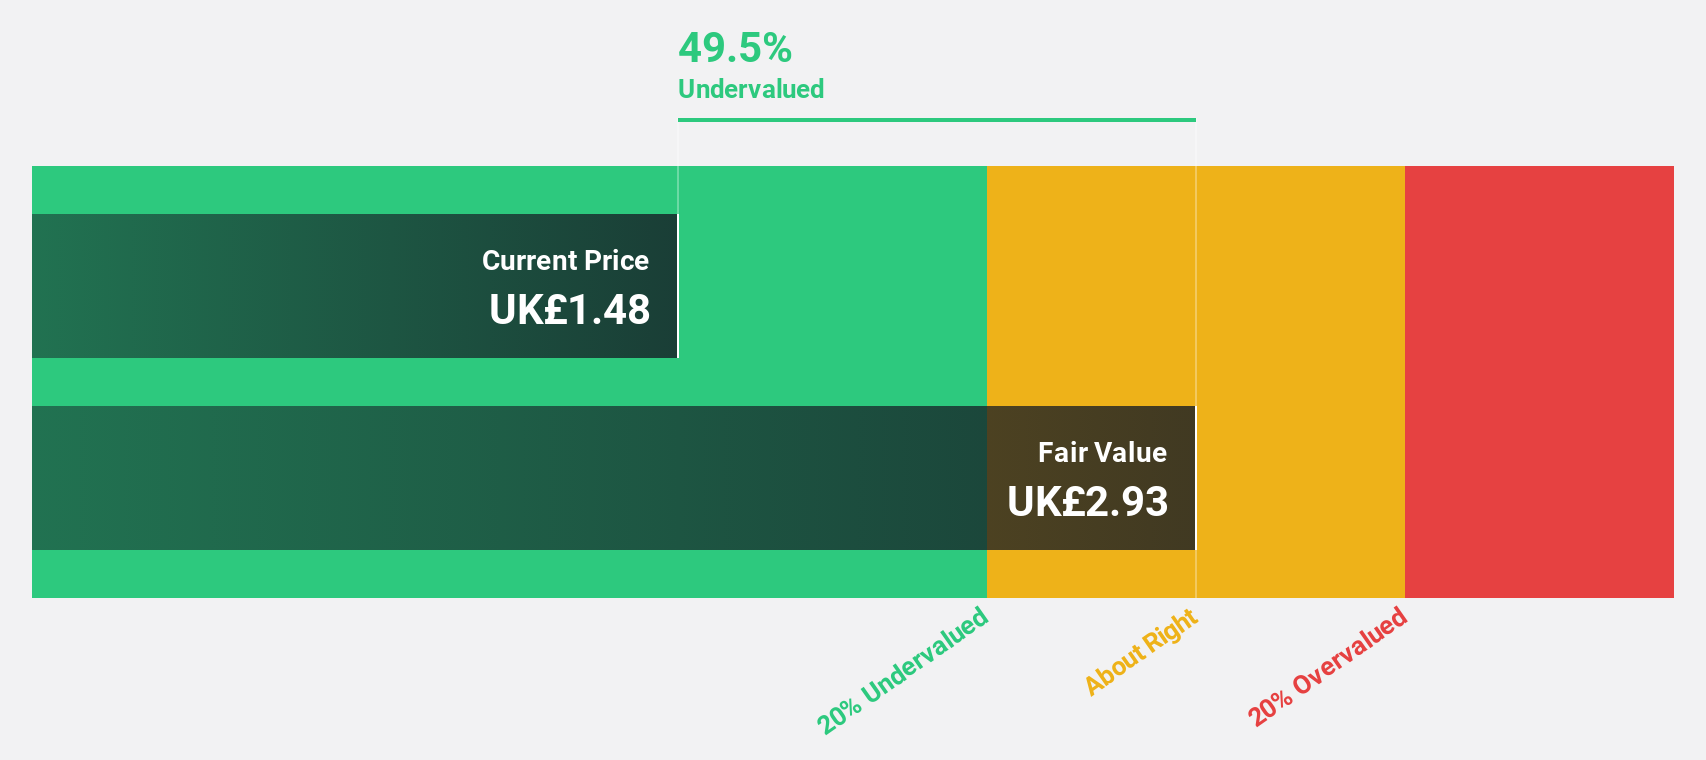
Estimated Discount To Fair Value: 49.1%
The Gym Group is trading at £1.48, significantly below its estimated fair value of £2.9, indicating potential undervaluation based on cash flows. Earnings are forecast to grow at 23.6% annually, faster than the UK market average of 13.8%. Recent earnings showed a strong increase in net income to £3.3 million for H1 2025 from £0.2 million last year, despite revenue growth being slower than desired at 8%.
- Our growth report here indicates Gym Group may be poised for an improving outlook.
- Navigate through the intricacies of Gym Group with our comprehensive financial health report here.
Summing It All Up
- Reveal the 51 hidden gems among our Undervalued UK Stocks Based On Cash Flows screener with a single click here.
- Have a stake in these businesses? Integrate your holdings into Simply Wall St's portfolio for notifications and detailed stock reports.
- Simply Wall St is your key to unlocking global market trends, a free user-friendly app for forward-thinking investors.
Contemplating Other Strategies?
- Explore high-performing small cap companies that haven't yet garnered significant analyst attention.
- Diversify your portfolio with solid dividend payers offering reliable income streams to weather potential market turbulence.
- Fuel your portfolio with companies showing strong growth potential, backed by optimistic outlooks both from analysts and management.
This article by Simply Wall St is general in nature. We provide commentary based on historical data and analyst forecasts only using an unbiased methodology and our articles are not intended to be financial advice. It does not constitute a recommendation to buy or sell any stock, and does not take account of your objectives, or your financial situation. We aim to bring you long-term focused analysis driven by fundamental data. Note that our analysis may not factor in the latest price-sensitive company announcements or qualitative material. Simply Wall St has no position in any stocks mentioned.
New: Manage All Your Stock Portfolios in One Place
We've created the ultimate portfolio companion for stock investors, and it's free.
• Connect an unlimited number of Portfolios and see your total in one currency
• Be alerted to new Warning Signs or Risks via email or mobile
• Track the Fair Value of your stocks
Have feedback on this article? Concerned about the content? Get in touch with us directly. Alternatively, email editorial-team@simplywallst.com
About LSE:GYM
Gym Group
Operates a network of gym facilities under the Gym Group brand name in the United Kingdom.
Reasonable growth potential and fair value.
Similar Companies
Market Insights

Advertisement
Community Narratives
MicroVision will explode future revenue by 380.37% with a vision towards success
Fair Value US$60.00|98.4% undervalued
TH
Community Contributor
The Indispensable Artery for a New North American Economy
Fair Value CA$132.87|1.3% undervalued
TI
Community Contributor