
Advertisement
- United States
- /
- Hospitality
- /
- NasdaqGS:RRR
These 4 Measures Indicate That Red Rock Resorts (NASDAQ:RRR) Is Using Debt In A Risky Way
The external fund manager backed by Berkshire Hathaway's Charlie Munger, Li Lu, makes no bones about it when he says 'The biggest investment risk is not the volatility of prices, but whether you will suffer a permanent loss of capital. So it seems the smart money knows that debt - which is usually involved in bankruptcies - is a very important factor, when you assess how risky a company is. Importantly, Red Rock Resorts, Inc. (NASDAQ:RRR) does carry debt. But should shareholders be worried about its use of debt?
When Is Debt Dangerous?
Debt and other liabilities become risky for a business when it cannot easily fulfill those obligations, either with free cash flow or by raising capital at an attractive price. Part and parcel of capitalism is the process of 'creative destruction' where failed businesses are mercilessly liquidated by their bankers. However, a more frequent (but still costly) occurrence is where a company must issue shares at bargain-basement prices, permanently diluting shareholders, just to shore up its balance sheet. Of course, the upside of debt is that it often represents cheap capital, especially when it replaces dilution in a company with the ability to reinvest at high rates of return. When we think about a company's use of debt, we first look at cash and debt together.
See our latest analysis for Red Rock Resorts
How Much Debt Does Red Rock Resorts Carry?
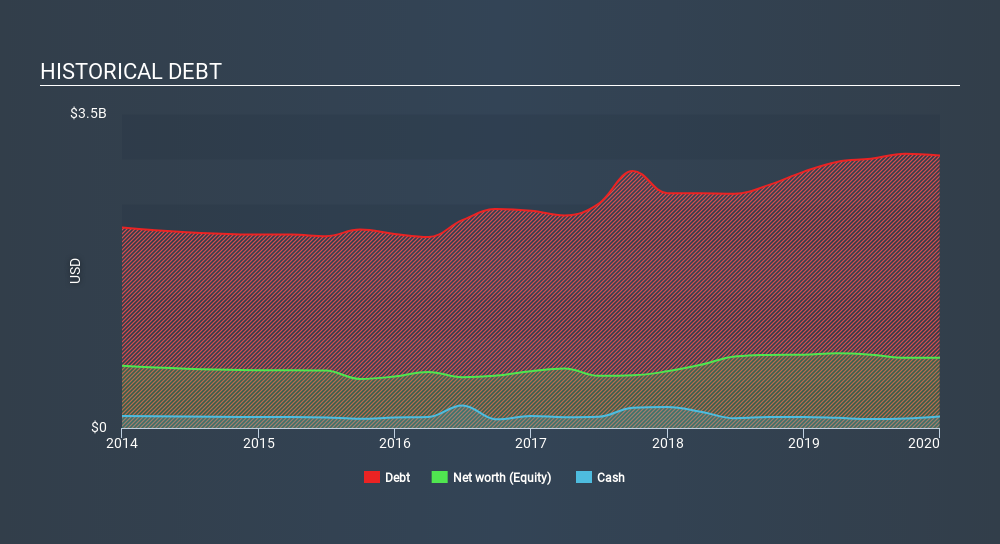
The image below, which you can click on for greater detail, shows that at December 2019 Red Rock Resorts had debt of US$3.04b, up from US$2.86b in one year. On the flip side, it has US$128.8m in cash leading to net debt of about US$2.91b.
How Strong Is Red Rock Resorts's Balance Sheet?
The latest balance sheet data shows that Red Rock Resorts had liabilities of US$276.0m due within a year, and liabilities of US$3.06b falling due after that. On the other hand, it had cash of US$128.8m and US$56.7m worth of receivables due within a year. So its liabilities outweigh the sum of its cash and (near-term) receivables by US$3.15b.
The deficiency here weighs heavily on the US$1.15b company itself, as if a child were struggling under the weight of an enormous back-pack full of books, his sports gear, and a trumpet. So we'd watch its balance sheet closely, without a doubt. After all, Red Rock Resorts would likely require a major re-capitalisation if it had to pay its creditors today.
We measure a company's debt load relative to its earnings power by looking at its net debt divided by its earnings before interest, tax, depreciation, and amortization (EBITDA) and by calculating how easily its earnings before interest and tax (EBIT) cover its interest expense (interest cover). The advantage of this approach is that we take into account both the absolute quantum of debt (with net debt to EBITDA) and the actual interest expenses associated with that debt (with its interest cover ratio).
Weak interest cover of 1.5 times and a disturbingly high net debt to EBITDA ratio of 5.9 hit our confidence in Red Rock Resorts like a one-two punch to the gut. This means we'd consider it to have a heavy debt load. Another concern for investors might be that Red Rock Resorts's EBIT fell 15% in the last year. If things keep going like that, handling the debt will about as easy as bundling an angry house cat into its travel box. When analysing debt levels, the balance sheet is the obvious place to start. But it is future earnings, more than anything, that will determine Red Rock Resorts's ability to maintain a healthy balance sheet going forward. So if you're focused on the future you can check out this free report showing analyst profit forecasts.
Finally, a company can only pay off debt with cold hard cash, not accounting profits. So we always check how much of that EBIT is translated into free cash flow. Over the last three years, Red Rock Resorts saw substantial negative free cash flow, in total. While that may be a result of expenditure for growth, it does make the debt far more risky.
Our View
On the face of it, Red Rock Resorts's conversion of EBIT to free cash flow left us tentative about the stock, and its level of total liabilities was no more enticing than the one empty restaurant on the busiest night of the year. And furthermore, its interest cover also fails to instill confidence. It looks to us like Red Rock Resorts carries a significant balance sheet burden. If you play with fire you risk getting burnt, so we'd probably give this stock a wide berth. The balance sheet is clearly the area to focus on when you are analysing debt. However, not all investment risk resides within the balance sheet - far from it. Case in point: We've spotted 3 warning signs for Red Rock Resorts you should be aware of, and 1 of them is potentially serious.
When all is said and done, sometimes its easier to focus on companies that don't even need debt. Readers can access a list of growth stocks with zero net debt 100% free, right now.
If you spot an error that warrants correction, please contact the editor at editorial-team@simplywallst.com. This article by Simply Wall St is general in nature. It does not constitute a recommendation to buy or sell any stock, and does not take account of your objectives, or your financial situation. Simply Wall St has no position in the stocks mentioned.
We aim to bring you long-term focused research analysis driven by fundamental data. Note that our analysis may not factor in the latest price-sensitive company announcements or qualitative material. Thank you for reading.
MI

The Foxhole
Gold miners still look inexpensive because the market thinks we're near the top of the cycle. Given what's happening to the dollar, I'm not so sure.
2219
ST
steve_investor
Is it a safer bet on gold to have just exposure to ETFs?
MA
marcus_l38oa
Between 2003 and 2011, gold nearly went 5x. Dollar went weak too. The gold companies did bad. It is worth noting that between 2003 and 2011, there was 2008! I will leave it your inference and research.
About NasdaqGS:RRR
Red Rock Resorts
Through its interest in Station Casinos LLC, develops and manages casino and entertainment properties in the United States.
Very undervalued second-rate dividend payer.
Similar Companies
Market Insights


Advertisement
Weekly Picks
RI


Rick_Orford on Starfighters Space ·
The 1960s Fighter Jet That Could Crack Open a $20 Billion Satellite Market
Fair Value:US$522.0% undervalued
63 followersusers have followed this narrative
4 commentsusers have commented on this narrative
10 likesusers have liked this narrative
JO


John_Eric on MercadoLibre ·
MercadoLibre and the Spreadsheet Trick That Decides Everything
Fair Value:US$7.31k73.7% undervalued
114 followersusers have followed this narrative
3 commentsusers have commented on this narrative
17 likesusers have liked this narrative
RC

rcb9 on PayPal Holdings ·
Ten Percent More Volume, One Percent More Transaction Margin
Fair Value:US$70.8913.2% undervalued
17 followersusers have followed this narrative
1 commentusers have commented on this narrative
6 likesusers have liked this narrative
HE


HedgeY on Micron Technology ·
Micron - The Memory Bottleneck Behind the AI Supercycle
Fair Value:US$1.25k22.7% undervalued
46 followersusers have followed this narrative
0 commentsusers have commented on this narrative
17 likesusers have liked this narrative
Recently Updated Narratives
AL

AlfredB on Bambuser ·
The Market is Asleep on Bambuser ...A Forensic Look at a Textbook SaaS Turnaround and AI Pivot
Fair Value:SEK 14684.7% undervalued
1 followerusers have followed this narrative
1 commentusers have commented on this narrative
0 likesusers have liked this narrative
AN


andre_santos on McDonald's ·
McDonald's - A Fundamental Valuation
Fair Value:US$233.6716.0% overvalued
40 followersusers have followed this narrative
0 commentsusers have commented on this narrative
0 likesusers have liked this narrative
OL

OLetourneau on Eaton ·
Electrical Infrastructure Rail
Fair Value:US$37711.2% overvalued
1 followerusers have followed this narrative
0 commentsusers have commented on this narrative
0 likesusers have liked this narrative
Popular Narratives
OS


oscargarcia on NVIDIA ·
The company that went from selling GPUs to gamers to becoming the AI arms dealer of the 21st century.
Fair Value:US$28023.3% undervalued
345 followersusers have followed this narrative
9 commentsusers have commented on this narrative
16 likesusers have liked this narrative
CU

CubanEros on Microsoft ·
A wonderful business at reasonable price.
Fair Value:US$419.9115.1% overvalued
193 followersusers have followed this narrative
0 commentsusers have commented on this narrative
9 likesusers have liked this narrative
KI

KiwiInvest on Amazon.com ·
Amazon's high growth, high tech segments propel its profits, while traditional segments plod along
Fair Value:US$475.0945.6% undervalued
221 followersusers have followed this narrative
1 commentusers have commented on this narrative
8 likesusers have liked this narrative
Trending Discussion


JO
johnk72 on Global X AI Infrastructure ETF ·
Great picks & shovels investment. I hold 3,000 units with a plan to hold until the end of 2028
2
|0