- United States
- /
- Insurance
- /
- NasdaqGS:DGIC.B
Read This Before You Buy Donegal Group Inc. (NASDAQ:DGIC.B) Because Of Its P/E Ratio


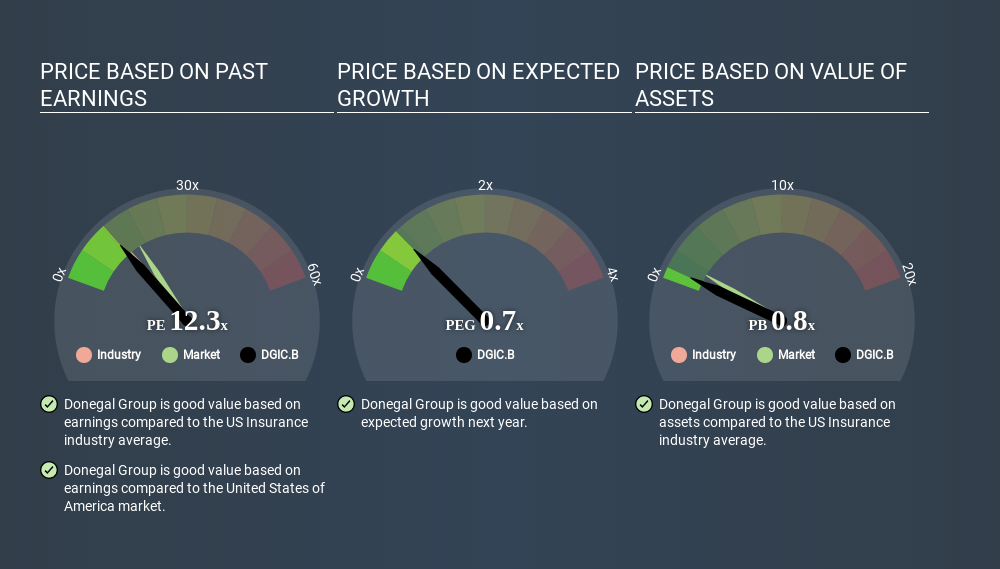
The goal of this article is to teach you how to use price to earnings ratios (P/E ratios). To keep it practical, we'll show how Donegal Group Inc.'s (NASDAQ:DGIC.B) P/E ratio could help you assess the value on offer. Donegal Group has a price to earnings ratio of 12.85, based on the last twelve months. That is equivalent to an earnings yield of about 7.8%.
View our latest analysis for Donegal Group
How Do You Calculate A P/E Ratio?
The formula for price to earnings is:
Price to Earnings Ratio = Share Price ÷ Earnings per Share (EPS)
Or for Donegal Group:
P/E of 12.85 = $12.490 ÷ $0.972 (Based on the trailing twelve months to March 2020.)
(Note: the above calculation results may not be precise due to rounding.)
Is A High P/E Ratio Good?
The higher the P/E ratio, the higher the price tag of a business, relative to its trailing earnings. That isn't necessarily good or bad, but a high P/E implies relatively high expectations of what a company can achieve in the future.
Does Donegal Group Have A Relatively High Or Low P/E For Its Industry?
We can get an indication of market expectations by looking at the P/E ratio. You can see in the image below that the average P/E (13.6) for companies in the insurance industry is roughly the same as Donegal Group's P/E.
Donegal Group's P/E tells us that market participants think its prospects are roughly in line with its industry. If the company has better than average prospects, then the market might be underestimating it. Checking factors such as director buying and selling. could help you form your own view on if that will happen.
How Growth Rates Impact P/E Ratios
Probably the most important factor in determining what P/E a company trades on is the earnings growth. That's because companies that grow earnings per share quickly will rapidly increase the 'E' in the equation. And in that case, the P/E ratio itself will drop rather quickly. And as that P/E ratio drops, the company will look cheap, unless its share price increases.
Donegal Group's earnings made like a rocket, taking off 224% last year. Having said that, the average EPS growth over the last three years wasn't so good, coming in at 2.6%.
Don't Forget: The P/E Does Not Account For Debt or Bank Deposits
One drawback of using a P/E ratio is that it considers market capitalization, but not the balance sheet. That means it doesn't take debt or cash into account. Theoretically, a business can improve its earnings (and produce a lower P/E in the future) by investing in growth. That means taking on debt (or spending its cash).
Such spending might be good or bad, overall, but the key point here is that you need to look at debt to understand the P/E ratio in context.
So What Does Donegal Group's Balance Sheet Tell Us?
Since Donegal Group holds net cash of US$35m, it can spend on growth, justifying a higher P/E ratio than otherwise.
The Bottom Line On Donegal Group's P/E Ratio
Donegal Group has a P/E of 12.9. That's below the average in the US market, which is 16.4. It grew its EPS nicely over the last year, and the healthy balance sheet implies there is more potential for growth. One might conclude that the market is a bit pessimistic, given the low P/E ratio.
When the market is wrong about a stock, it gives savvy investors an opportunity. If it is underestimating a company, investors can make money by buying and holding the shares until the market corrects itself. So this free visualization of the analyst consensus on future earnings could help you make the right decision about whether to buy, sell, or hold.
But note: Donegal Group may not be the best stock to buy. So take a peek at this free list of interesting companies with strong recent earnings growth (and a P/E ratio below 20).
Love or hate this article? Concerned about the content? Get in touch with us directly. Alternatively, email editorial-team@simplywallst.com.
This article by Simply Wall St is general in nature. It does not constitute a recommendation to buy or sell any stock, and does not take account of your objectives, or your financial situation. We aim to bring you long-term focused analysis driven by fundamental data. Note that our analysis may not factor in the latest price-sensitive company announcements or qualitative material. Simply Wall St has no position in any stocks mentioned. Thank you for reading.
About NasdaqGS:DGIC.B
Donegal Group
An insurance holding company, provides commercial and personal lines of property and casualty coverages.
Excellent balance sheet established dividend payer.
Market Insights

Community Narratives

