Advertisement
- United States
- /
- Consumer Finance
- /
- NYSE:HTT
Qudian Inc.'s (NYSE:QD) Sentiment Matching Earnings
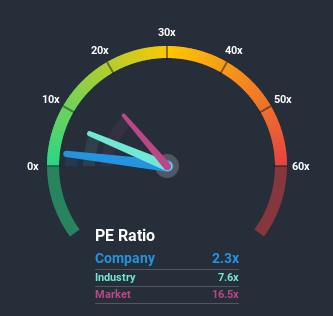
When close to half the companies in the United States have price-to-earnings ratios (or "P/E's") above 17x, you may consider Qudian Inc. (NYSE:QD) as a highly attractive investment with its 2.3x P/E ratio. Nonetheless, we'd need to dig a little deeper to determine if there is a rational basis for the highly reduced P/E.
While the market has experienced earnings growth lately, Qudian's earnings have gone into reverse gear, which is not great. The P/E is probably low because investors think this poor earnings performance isn't going to get any better. If you still like the company, you'd be hoping this isn't the case so that you could potentially pick up some stock while it's out of favour.
See our latest analysis for Qudian
Does Qudian Have A Relatively High Or Low P/E For Its Industry?
An inspection of average P/E's throughout Qudian's industry may help to explain its particularly low P/E ratio. It turns out the Consumer Finance industry in general also has a P/E ratio significantly lower than the market, as the graphic below shows. So we'd say there is merit in the premise that the company's ratio being shaped by its industry at this time. Ordinarily, the majority of companies' P/E's would be compressed firmly by the general conditions within the Consumer Finance industry. Whilst this can be a heavy component, industry factors are normally secondary to company financials and earnings.
Does Growth Match The Low P/E?
Qudian's P/E ratio would be typical for a company that's expected to deliver very poor growth or even falling earnings, and importantly, perform much worse than the market.
Retrospectively, the last year delivered a frustrating 32% decrease to the company's bottom line. This means it has also seen a slide in earnings over the longer-term as EPS is down 47% in total over the last three years. Therefore, it's fair to say the earnings growth recently has been undesirable for the company.
Looking ahead now, EPS is anticipated to plummet, contracting by 148% during the coming year according to the six analysts following the company. With the rest of the market predicted to shrink by 13%, it's a sub-optimal result.
With this information, it's not too hard to see why Qudian is trading at a lower P/E in comparison. However, when earnings shrink rapidly the P/E often shrinks too, which could set up shareholders for future disappointment. Even just maintaining these prices could be difficult achieve as the weak outlook is already weighing down the shares heavily.
The Key Takeaway
Using the price-to-earnings ratio alone to determine if you should sell your stock isn't sensible, however it can be a practical guide to the company's future prospects.
We've established that Qudian maintains its low P/E on the weakness of its earnings forecast being even worse than the struggling market, as expected. Right now shareholders are accepting the low P/E as they concede future earnings probably won't provide any pleasant surprises. However, we're still cautious about the company's ability to resist even greater pain to its business from the broader market turmoil. For now though, it's hard to see the share price rising strongly in the near future under these circumstances.
Having said that, be aware Qudian is showing 3 warning signs in our investment analysis, you should know about.
Of course, you might also be able to find a better stock than Qudian. So you may wish to see this free collection of other companies that sit on P/E's below 20x and have grown earnings strongly.
If you decide to trade Qudian, use the lowest-cost* platform that is rated #1 Overall by Barron’s, Interactive Brokers. Trade stocks, options, futures, forex, bonds and funds on 135 markets, all from a single integrated account.Promoted
Valuation is complex, but we're here to simplify it.
Discover if High Templar Tech might be undervalued or overvalued with our detailed analysis, featuring fair value estimates, potential risks, dividends, insider trades, and its financial condition.
Access Free AnalysisThis article by Simply Wall St is general in nature. It does not constitute a recommendation to buy or sell any stock, and does not take account of your objectives, or your financial situation. We aim to bring you long-term focused analysis driven by fundamental data. Note that our analysis may not factor in the latest price-sensitive company announcements or qualitative material. Simply Wall St has no position in any stocks mentioned.
*Interactive Brokers Rated Lowest Cost Broker by StockBrokers.com Annual Online Review 2020
Have feedback on this article? Concerned about the content? Get in touch with us directly. Alternatively, email editorial-team@simplywallst.com.
About NYSE:HTT
High Templar Tech
Operates as a consumer-oriented financial technology service company in the People’s Republic of China.
Proven track record with adequate balance sheet.
Similar Companies
Market Insights


Advertisement
Weekly Picks
LO


Lou_Basenese on Giftify ·
Giftify ($GIFT): A Small-Cap Incentives Platform with More ScaleThan Its Valuation Suggests
Fair Value:US$2.563.5% undervalued
59 followersusers have followed this narrative
2 commentsusers have commented on this narrative
11 likesusers have liked this narrative
HA


HarishPK on lululemon athletica ·
Quantifying the Transition: Why Lululemon’s Moat Remains Intact
Fair Value:US$161.826.3% undervalued
23 followersusers have followed this narrative
2 commentsusers have commented on this narrative
9 likesusers have liked this narrative
TR


tripledub on Alphabet ·
Warren Buffett Just Bet $10 Billion on Google. The Catch? You May Already Be Too Late.
Fair Value:US$23055.3% overvalued
62 followersusers have followed this narrative
1 commentusers have commented on this narrative
16 likesusers have liked this narrative
JO


John_Eric on Veeva Systems ·
AI-Powered Veeva Systems Poised for Solid Growth Amid Regulatory Stability
Fair Value:US$32040.6% undervalued
32 followersusers have followed this narrative
0 commentsusers have commented on this narrative
6 likesusers have liked this narrative
Recently Updated Narratives
PI

PittTheYounger on Delta Air Lines ·
Delta loses shine after warning of falling travel demand, but still industry leader
Fair Value:US$63.2138.3% overvalued
19 followersusers have followed this narrative
0 commentsusers have commented on this narrative
0 likesusers have liked this narrative
PI

PittTheYounger on easyJet ·
EasyJet weirdly unloved by investors in spite of relatively attractive metrics
Fair Value:UK£6.953.3% undervalued
36 followersusers have followed this narrative
10 commentsusers have commented on this narrative
0 likesusers have liked this narrative
TI

TimLee on Minox International Group Berhad ·
Minox International: Undervalued Industrial Play with High-Tech Catalysts
Fair Value:RM 0.3555.7% undervalued
1 followerusers have followed this narrative
0 commentsusers have commented on this narrative
0 likesusers have liked this narrative
Popular Narratives
IN


Investingwilly on Mastercard ·
Mastercard: The Best Dividend Stock You're Ignoring
Fair Value:US$75029.8% undervalued
87 followersusers have followed this narrative
1 commentusers have commented on this narrative
9 likesusers have liked this narrative
BL


BlackGoat on Cerebras Systems ·
The Wafer Giant Threatening NVIDIA's GPU Hegemony
Fair Value:US$415.5448.2% undervalued
60 followersusers have followed this narrative
3 commentsusers have commented on this narrative
11 likesusers have liked this narrative
TR
tripledub on Alphabet ·
Warren Buffett Just Bet $10 Billion on Google. The Catch? You May Already Be Too Late.
Fair Value:US$23055.3% overvalued
62 followersusers have followed this narrative
1 commentusers have commented on this narrative
16 likesusers have liked this narrative
