
Advertisement
- United States
- /
- Construction
- /
- NYSE:EME
Is EMCOR Group, Inc. (NYSE:EME) Worth US$87.5 Based On Its Intrinsic Value?
Today we'll do a simple run through of a valuation method used to estimate the attractiveness of EMCOR Group, Inc. (NYSE:EME) as an investment opportunity by taking the expected future cash flows and discounting them to their present value. I will use the Discounted Cash Flow (DCF) model. Don't get put off by the jargon, the math behind it is actually quite straightforward.
Remember though, that there are many ways to estimate a company's value, and a DCF is just one method. If you want to learn more about discounted cash flow, the rationale behind this calculation can be read in detail in the Simply Wall St analysis model.
View our latest analysis for EMCOR Group
What's the estimated valuation?
We use what is known as a 2-stage model, which simply means we have two different periods of growth rates for the company's cash flows. Generally the first stage is higher growth, and the second stage is a lower growth phase. To begin with, we have to get estimates of the next ten years of cash flows. Where possible we use analyst estimates, but when these aren't available we extrapolate the previous free cash flow (FCF) from the last estimate or reported value. We assume companies with shrinking free cash flow will slow their rate of shrinkage, and that companies with growing free cash flow will see their growth rate slow, over this period. We do this to reflect that growth tends to slow more in the early years than it does in later years.
Generally we assume that a dollar today is more valuable than a dollar in the future, so we discount the value of these future cash flows to their estimated value in today's dollars:
10-year free cash flow (FCF) estimate
| 2020 | 2021 | 2022 | 2023 | 2024 | 2025 | 2026 | 2027 | 2028 | 2029 | |
| Levered FCF ($, Millions) | US$249.8m | US$271.6m | US$252.7m | US$241.7m | US$235.6m | US$232.7m | US$231.9m | US$232.6m | US$234.2m | US$236.6m |
| Growth Rate Estimate Source | Analyst x3 | Analyst x2 | Est @ -6.95% | Est @ -4.34% | Est @ -2.52% | Est @ -1.24% | Est @ -0.35% | Est @ 0.28% | Est @ 0.72% | Est @ 1.02% |
| Present Value ($, Millions) Discounted @ 7.3% | US$233 | US$236 | US$205 | US$182 | US$166 | US$153 | US$142 | US$133 | US$124 | US$117 |
("Est" = FCF growth rate estimated by Simply Wall St)
Present Value of 10-year Cash Flow (PVCF) = US$1.7b
The second stage is also known as Terminal Value, this is the business's cash flow after the first stage. For a number of reasons a very conservative growth rate is used that cannot exceed that of a country's GDP growth. In this case we have used the 10-year government bond rate (1.7%) to estimate future growth. In the same way as with the 10-year 'growth' period, we discount future cash flows to today's value, using a cost of equity of 7.3%.
Terminal Value (TV)= FCF2029 × (1 + g) ÷ (r – g) = US$237m× (1 + 1.7%) ÷ 7.3%– 1.7%) = US$4.3b
Present Value of Terminal Value (PVTV)= TV / (1 + r)10= US$4.3b÷ ( 1 + 7.3%)10= US$2.1b
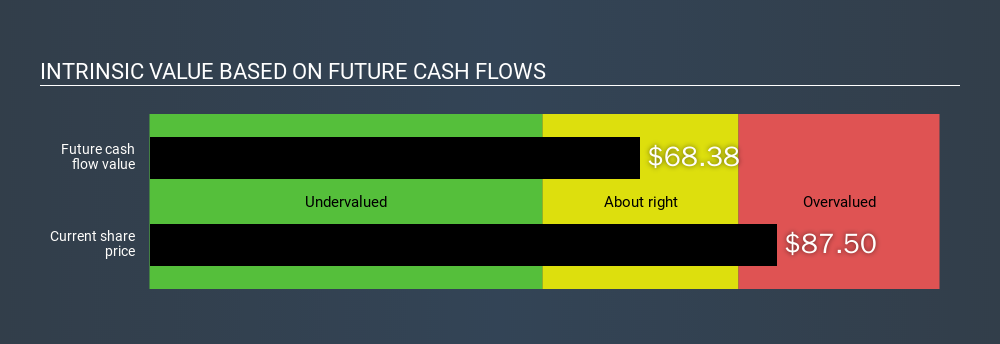
The total value is the sum of cash flows for the next ten years plus the discounted terminal value, which results in the Total Equity Value, which in this case is US$3.8b. To get the intrinsic value per share, we divide this by the total number of shares outstanding. Compared to the current share price of US$87.5, the company appears slightly overvalued at the time of writing. The assumptions in any calculation have a big impact on the valuation, so it is better to view this as a rough estimate, not precise down to the last cent.
The assumptions
Now the most important inputs to a discounted cash flow are the discount rate, and of course, the actual cash flows. You don't have to agree with these inputs, I recommend redoing the calculations yourself and playing with them. The DCF also does not consider the possible cyclicality of an industry, or a company's future capital requirements, so it does not give a full picture of a company's potential performance. Given that we are looking at EMCOR Group as potential shareholders, the cost of equity is used as the discount rate, rather than the cost of capital (or weighted average cost of capital, WACC) which accounts for debt. In this calculation we've used 7.3%, which is based on a levered beta of 1.019. Beta is a measure of a stock's volatility, compared to the market as a whole. We get our beta from the industry average beta of globally comparable companies, with an imposed limit between 0.8 and 2.0, which is a reasonable range for a stable business.
Next Steps:
Although the valuation of a company is important, it shouldn’t be the only metric you look at when researching a company. The DCF model is not a perfect stock valuation tool. Rather it should be seen as a guide to "what assumptions need to be true for this stock to be under/overvalued?" If a company grows at a different rate, or if its cost of equity or risk free rate changes sharply, the output can look very different. What is the reason for the share price to differ from the intrinsic value? For EMCOR Group, I've put together three essential aspects you should look at:
- Financial Health: Does EME have a healthy balance sheet? Take a look at our free balance sheet analysis with six simple checks on key factors like leverage and risk.
- Future Earnings: How does EME's growth rate compare to its peers and the wider market? Dig deeper into the analyst consensus number for the upcoming years by interacting with our free analyst growth expectation chart.
- Other High Quality Alternatives: Are there other high quality stocks you could be holding instead of EME? Explore our interactive list of high quality stocks to get an idea of what else is out there you may be missing!
PS. Simply Wall St updates its DCF calculation for every US stock every day, so if you want to find the intrinsic value of any other stock just search here.
If you spot an error that warrants correction, please contact the editor at editorial-team@simplywallst.com. This article by Simply Wall St is general in nature. It does not constitute a recommendation to buy or sell any stock, and does not take account of your objectives, or your financial situation. Simply Wall St has no position in the stocks mentioned.
We aim to bring you long-term focused research analysis driven by fundamental data. Note that our analysis may not factor in the latest price-sensitive company announcements or qualitative material. Thank you for reading.
MI

The Foxhole
A landmark settlement is meant to punish Meta (META). If the 1998 tobacco deal is any guide, it might protect it.
149
ZO
zoe_vi5fn
Any moat with an opt-out clause for your competitors is just a fence around your own garden.
CO
connor_iwn1g
Worth looking at what previous legal action actually did to Meta rather than reaching for tobacco. The FTC's record five billion dollar privacy fine in 2019 was met with the stock rising, because it came in below fears and removed an open question. GDPR was designed to constrain large platforms and increased their share of the European ad market, because compliance cost fell hardest on small intermediaries. The FTC's antitrust case, the one that could genuinely have broken the company up, was decided in Meta's favour last November. The only thing that ever meaningfully hurt the business was Apple changing a tracking default, and Meta out-spent that too, while the ad-tech firms that could not afford to rebuild disappeared. The pattern is not that Meta survives regulation. It is that regulation keeps costing its smaller competitors more.
 Andrew Legget
Market Insights
Great earnings season, but are the earnings real?

At first glance, this was the strongest earnings season in years. But when you look at where the growth actually came from, the story splits into two very different pictures.
10
About NYSE:EME
EMCOR Group
Provides electrical and mechanical construction and facilities, building, and industrial services in the United States and the United Kingdom.
Very undervalued with flawless balance sheet.
Similar Companies
Market Insights


Advertisement
Weekly Picks
LO


Lou_Basenese on Oncolytics Biotech ·
The Team Behind a $2 Billion Johnson & Johnson (JNJ) Deal Just Took Over This $105 Million Cancer Biotech
Fair Value:US$3.575.5% undervalued
29 followersusers have followed this narrative
0 commentsusers have commented on this narrative
7 likesusers have liked this narrative
TR


tripledub on Meta Platforms ·
The $135 Billion Bet That Should Make Every Shareholder Nervous
Fair Value:US$5861.4% undervalued
60 followersusers have followed this narrative
3 commentsusers have commented on this narrative
34 likesusers have liked this narrative
TA


Talos on Voyager Technologies ·
The "Landlord of Orbit" – A Deep Value Play Ahead of the Starlab Era
Fair Value:US$385.291.1% undervalued
63 followersusers have followed this narrative
0 commentsusers have commented on this narrative
6 likesusers have liked this narrative
IV

Ivoed on Uber Technologies ·
Uber’s Valuation Depends On Who Captures The Economics Of Driverless Rides
Fair Value:US$11632.1% undervalued
12 followersusers have followed this narrative
0 commentsusers have commented on this narrative
3 likesusers have liked this narrative
Recently Updated Narratives
DA

dang on Resonance Health ·
Resonance Health will triple revenue growth to 30.83% in five years
Fair Value:AU$0.08331.3% undervalued
1 followerusers have followed this narrative
0 commentsusers have commented on this narrative
0 likesusers have liked this narrative
RO


RockeTeller on Santacruz Silver Mining ·
Santacruz Silver, 5.6M Oz Silver Producer Trading at Low Multiples, 100X Per-Share Upside in $200 Silver
Fair Value:CA$142.990.7% undervalued
96 followersusers have followed this narrative
14 commentsusers have commented on this narrative
0 likesusers have liked this narrative
CO


composite32 on Eaton ·
"Grid-to-Chip: How Eaton Controls the Physical Bottlenecks of AI Data Centers"
Fair Value:US$517.0622.1% undervalued
1 followerusers have followed this narrative
0 commentsusers have commented on this narrative
0 likesusers have liked this narrative
Popular Narratives
OS


oscargarcia on NVIDIA ·
The company that went from selling GPUs to gamers to becoming the AI arms dealer of the 21st century.
Fair Value:US$28022.3% undervalued
364 followersusers have followed this narrative
9 commentsusers have commented on this narrative
16 likesusers have liked this narrative
CU

CubanEros on Microsoft ·
A wonderful business at reasonable price.
Fair Value:US$419.9122.3% overvalued
213 followersusers have followed this narrative
0 commentsusers have commented on this narrative
9 likesusers have liked this narrative
KI

KiwiInvest on Amazon.com ·
Amazon's high growth, high tech segments propel its profits, while traditional segments plod along
Fair Value:US$475.0943.9% undervalued
240 followersusers have followed this narrative
1 commentusers have commented on this narrative
8 likesusers have liked this narrative


