Investors Holding Back On Kellton Tech Solutions Limited (NSE:KELLTONTEC)

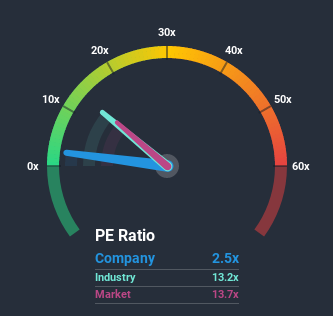
With a price-to-earnings (or "P/E") ratio of 2.5x Kellton Tech Solutions Limited (NSE:KELLTONTEC) may be sending very bullish signals at the moment, given that almost half of all companies in India have P/E ratios greater than 14x and even P/E's higher than 34x are not unusual. Although, it's not wise to just take the P/E at face value as there may be an explanation why it's so limited.
For instance, Kellton Tech Solutions' receding earnings in recent times would have to be some food for thought. It might be that many expect the disappointing earnings performance to continue or accelerate, which has repressed the P/E. However, if this doesn't eventuate then existing shareholders may be feeling optimistic about the future direction of the share price.
See our latest analysis for Kellton Tech Solutions

Does Growth Match The Low P/E?
The only time you'd be truly comfortable seeing a P/E as depressed as Kellton Tech Solutions' is when the company's growth is on track to lag the market decidedly.
Retrospectively, the last year delivered a frustrating 3.5% decrease to the company's bottom line. Still, the latest three year period has seen an excellent 38% overall rise in EPS, in spite of its unsatisfying short-term performance. Although it's been a bumpy ride, it's still fair to say the earnings growth recently has been more than adequate for the company.
Comparing that to the market, which is only predicted to deliver 1.4% growth in the next 12 months, the company's momentum is stronger based on recent medium-term annualised earnings results.
With this information, we find it odd that Kellton Tech Solutions is trading at a P/E lower than the market. Apparently some shareholders believe the recent performance has exceeded its limits and have been accepting significantly lower selling prices.
What We Can Learn From Kellton Tech Solutions' P/E?
While the price-to-earnings ratio shouldn't be the defining factor in whether you buy a stock or not, it's quite a capable barometer of earnings expectations.
We've established that Kellton Tech Solutions currently trades on a much lower than expected P/E since its recent three-year growth is higher than the wider market forecast. There could be some major unobserved threats to earnings preventing the P/E ratio from matching this positive performance. At least price risks look to be very low if recent medium-term earnings trends continue, but investors seem to think future earnings could see a lot of volatility.
It's always necessary to consider the ever-present spectre of investment risk. We've identified 2 warning signs with Kellton Tech Solutions, and understanding them should be part of your investment process.
If you're unsure about the strength of Kellton Tech Solutions' business, why not explore our interactive list of stocks with solid business fundamentals for some other companies you may have missed.
If you’re looking to trade Kellton Tech Solutions, open an account with the lowest-cost* platform trusted by professionals, Interactive Brokers. Their clients from over 200 countries and territories trade stocks, options, futures, forex, bonds and funds worldwide from a single integrated account. Promoted
Valuation is complex, but we're here to simplify it.
Discover if Kellton Tech Solutions might be undervalued or overvalued with our detailed analysis, featuring fair value estimates, potential risks, dividends, insider trades, and its financial condition.
Access Free AnalysisThis article by Simply Wall St is general in nature. It does not constitute a recommendation to buy or sell any stock, and does not take account of your objectives, or your financial situation. We aim to bring you long-term focused analysis driven by fundamental data. Note that our analysis may not factor in the latest price-sensitive company announcements or qualitative material. Simply Wall St has no position in any stocks mentioned.
*Interactive Brokers Rated Lowest Cost Broker by StockBrokers.com Annual Online Review 2020
Have feedback on this article? Concerned about the content? Get in touch with us directly. Alternatively, email editorial-team@simplywallst.com.
About NSEI:KELLTONTEC
Kellton Tech Solutions
Provides digital transformation, ERP, and other IT services in Asia Pacific, Europe, the United States, and internationally.
Flawless balance sheet and slightly overvalued.

