If You Had Bought Kitex Garments' (NSE:KITEX) Shares Five Years Ago You Would Be Down 79%


Long term investing is the way to go, but that doesn't mean you should hold every stock forever. We don't wish catastrophic capital loss on anyone. Spare a thought for those who held Kitex Garments Limited (NSE:KITEX) for five whole years - as the share price tanked 79%. It's down 2.1% in the last seven days.
Check out our latest analysis for Kitex Garments
To paraphrase Benjamin Graham: Over the short term the market is a voting machine, but over the long term it's a weighing machine. One way to examine how market sentiment has changed over time is to look at the interaction between a company's share price and its earnings per share (EPS).
During the unfortunate half decade during which the share price slipped, Kitex Garments actually saw its earnings per share (EPS) improve by 0.4% per year. Given the share price reaction, one might suspect that EPS is not a good guide to the business performance during the period (perhaps due to a one-off loss or gain). Or possibly, the market was previously very optimistic, so the stock has disappointed, despite improving EPS.
Based on these numbers, we'd venture that the market may have been over-optimistic about forecast growth, half a decade ago. Looking to other metrics might better explain the share price change.
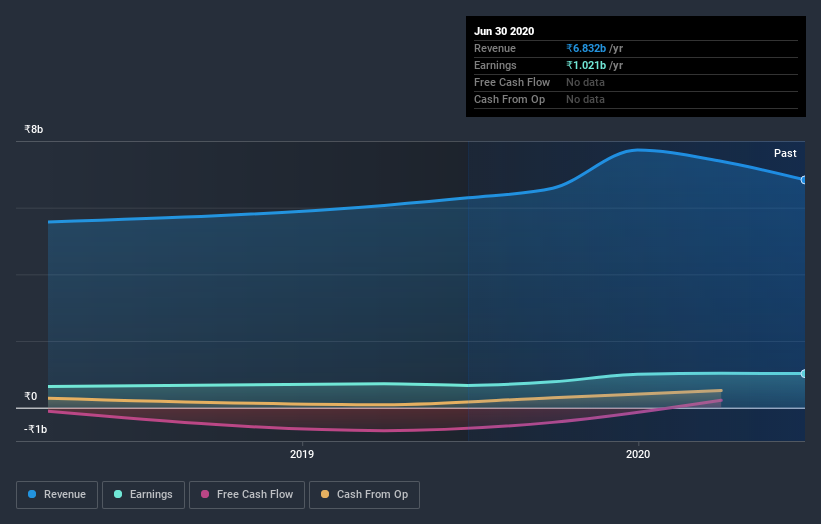
We don't think that the 1.5% is big factor in the share price, since it's quite small, as dividends go. In contrast to the share price, revenue has actually increased by 6.8% a year in the five year period. A more detailed examination of the revenue and earnings may or may not explain why the share price languishes; there could be an opportunity.
The graphic below depicts how earnings and revenue have changed over time (unveil the exact values by clicking on the image).
Take a more thorough look at Kitex Garments' financial health with this free report on its balance sheet.
A Different Perspective
It's good to see that Kitex Garments has rewarded shareholders with a total shareholder return of 21% in the last twelve months. That's including the dividend. That certainly beats the loss of about 12% per year over the last half decade. The long term loss makes us cautious, but the short term TSR gain certainly hints at a brighter future. I find it very interesting to look at share price over the long term as a proxy for business performance. But to truly gain insight, we need to consider other information, too. Take risks, for example - Kitex Garments has 2 warning signs (and 1 which doesn't sit too well with us) we think you should know about.
Of course, you might find a fantastic investment by looking elsewhere. So take a peek at this free list of companies we expect will grow earnings.
Please note, the market returns quoted in this article reflect the market weighted average returns of stocks that currently trade on IN exchanges.
When trading Kitex Garments or any other investment, use the platform considered by many to be the Professional's Gateway to the Worlds Market, Interactive Brokers. You get the lowest-cost* trading on stocks, options, futures, forex, bonds and funds worldwide from a single integrated account. Promoted
If you're looking to trade Kitex Garments, open an account with the lowest-cost platform trusted by professionals, Interactive Brokers.
With clients in over 200 countries and territories, and access to 160 markets, IBKR lets you trade stocks, options, futures, forex, bonds and funds from a single integrated account.
Enjoy no hidden fees, no account minimums, and FX conversion rates as low as 0.03%, far better than what most brokers offer.
Sponsored ContentValuation is complex, but we're here to simplify it.
Discover if Kitex Garments might be undervalued or overvalued with our detailed analysis, featuring fair value estimates, potential risks, dividends, insider trades, and its financial condition.
Access Free AnalysisThis article by Simply Wall St is general in nature. It does not constitute a recommendation to buy or sell any stock, and does not take account of your objectives, or your financial situation. We aim to bring you long-term focused analysis driven by fundamental data. Note that our analysis may not factor in the latest price-sensitive company announcements or qualitative material. Simply Wall St has no position in any stocks mentioned.
*Interactive Brokers Rated Lowest Cost Broker by StockBrokers.com Annual Online Review 2020
Have feedback on this article? Concerned about the content? Get in touch with us directly. Alternatively, email editorial-team@simplywallst.com.
About NSEI:KITEX
Kitex Garments
Manufactures and sells fabric and readymade garments for infants and children in India, the Unites States, and internationally.
Proven track record second-rate dividend payer.
