
Advertisement
- Australia
- /
- Consumer Durables
- /
- ASX:SIO
How Does Simonds Group's (ASX:SIO) P/E Compare To Its Industry, After Its Big Share Price Gain?
Simonds Group (ASX:SIO) shares have had a really impressive month, gaining 32%, after some slippage. While recent buyers might be laughing, long term holders might not be so pleased, since the recent gain only brings the full year return to evens.
All else being equal, a sharp share price increase should make a stock less attractive to potential investors. In the long term, share prices tend to follow earnings per share, but in the short term prices bounce around in response to short term factors (which are not always obvious). The implication here is that deep value investors might steer clear when expectations of a company are too high. One way to gauge market expectations of a stock is to look at its Price to Earnings Ratio (PE Ratio). A high P/E ratio means that investors have a high expectation about future growth, while a low P/E ratio means they have low expectations about future growth.
See our latest analysis for Simonds Group
Does Simonds Group Have A Relatively High Or Low P/E For Its Industry?
Simonds Group's P/E of 5.11 indicates relatively low sentiment towards the stock. The image below shows that Simonds Group has a lower P/E than the average (11.6) P/E for companies in the consumer durables industry.
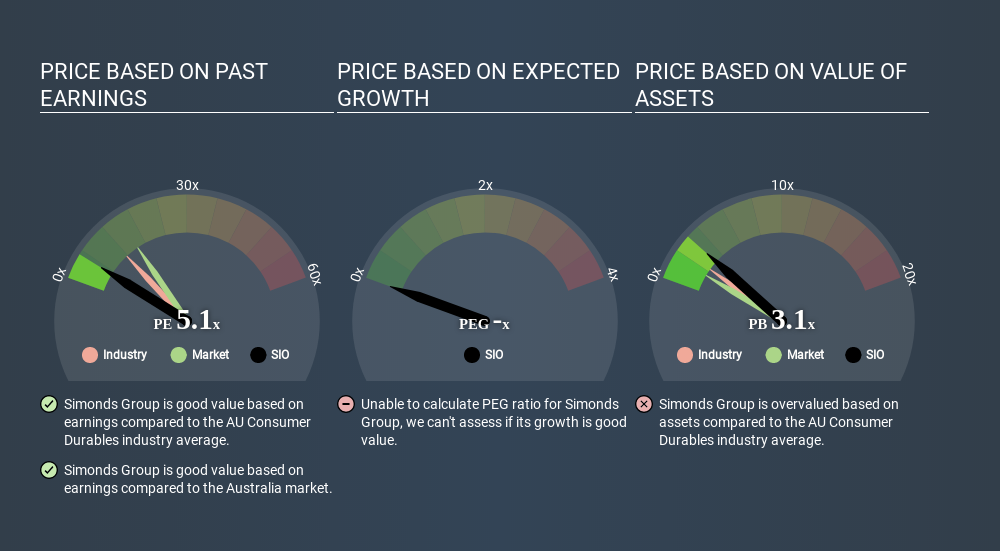
Its relatively low P/E ratio indicates that Simonds Group shareholders think it will struggle to do as well as other companies in its industry classification. Since the market seems unimpressed with Simonds Group, it's quite possible it could surprise on the upside. If you consider the stock interesting, further research is recommended. For example, I often monitor director buying and selling.
How Growth Rates Impact P/E Ratios
P/E ratios primarily reflect market expectations around earnings growth rates. When earnings grow, the 'E' increases, over time. Therefore, even if you pay a high multiple of earnings now, that multiple will become lower in the future. So while a stock may look expensive based on past earnings, it could be cheap based on future earnings.
Simonds Group saw earnings per share decrease by 8.6% last year.
A Limitation: P/E Ratios Ignore Debt and Cash In The Bank
Don't forget that the P/E ratio considers market capitalization. That means it doesn't take debt or cash into account. Hypothetically, a company could reduce its future P/E ratio by spending its cash (or taking on debt) to achieve higher earnings.
While growth expenditure doesn't always pay off, the point is that it is a good option to have; but one that the P/E ratio ignores.
Is Debt Impacting Simonds Group's P/E?
With net cash of AU$13m, Simonds Group has a very strong balance sheet, which may be important for its business. Having said that, at 28% of its market capitalization the cash hoard would contribute towards a higher P/E ratio.
The Verdict On Simonds Group's P/E Ratio
Simonds Group trades on a P/E ratio of 5.1, which is below the AU market average of 15.5. Falling earnings per share are likely to be keeping potential buyers away, the relatively strong balance sheet will allow the company time to invest in growth. If it achieves that, then there's real potential that the low P/E could eventually indicate undervaluation. What is very clear is that the market has become less pessimistic about Simonds Group over the last month, with the P/E ratio rising from 3.9 back then to 5.1 today. If you like to buy stocks that could be turnaround opportunities, then this one might be a candidate; but if you're more sensitive to price, then you may feel the opportunity has passed.
When the market is wrong about a stock, it gives savvy investors an opportunity. As value investor Benjamin Graham famously said, 'In the short run, the market is a voting machine but in the long run, it is a weighing machine. We don't have analyst forecasts, but shareholders might want to examine this detailed historical graph of earnings, revenue and cash flow.
Of course, you might find a fantastic investment by looking at a few good candidates. So take a peek at this free list of companies with modest (or no) debt, trading on a P/E below 20.
Love or hate this article? Concerned about the content? Get in touch with us directly. Alternatively, email editorial-team@simplywallst.com.
This article by Simply Wall St is general in nature. It does not constitute a recommendation to buy or sell any stock, and does not take account of your objectives, or your financial situation. We aim to bring you long-term focused analysis driven by fundamental data. Note that our analysis may not factor in the latest price-sensitive company announcements or qualitative material. Simply Wall St has no position in any stocks mentioned. Thank you for reading.
MI

The Foxhole
The world's in stitches over robots sprinting into walls. I still think they're the answer to our productivity problem.
87
DE
devon_jd150
What you have missed is that this event happened last year too. Last year the number was 21 seconds. This year it beat Bolt. That's 60% improvement in an year. Now extrapolate this in many axes of work that Robots can come and fill in. The physical productivity and AI boom is just starting.
LE
LeverageIsLovely
I can't pick a company. But I can pick a person. With no doubt that's Musk. Optimus for blue collar productivity increase and xAI for white collar productivity increase. Did anyone dabble with GrokBot here?
 Andrew Legget
Market Insights
Great earnings season, but are the earnings real?

At first glance, this was the strongest earnings season in years. But when you look at where the growth actually came from, the story splits into two very different pictures.
85
About ASX:SIO
Simonds Group
Designs, constructs, and sells residential dwellings in Australia.
Adequate balance sheet and slightly overvalued.
Similar Companies
Market Insights


Advertisement
Weekly Picks
LO


Lou_Basenese on Oncolytics Biotech ·
The Team Behind a $2 Billion Johnson & Johnson (JNJ) Deal Just Took Over This $105 Million Cancer Biotech
Fair Value:US$3.576.1% undervalued
44 followersusers have followed this narrative
0 commentsusers have commented on this narrative
12 likesusers have liked this narrative
TR


tripledub on Meta Platforms ·
The $135 Billion Bet That Should Make Every Shareholder Nervous
Fair Value:US$5862.3% undervalued
63 followersusers have followed this narrative
3 commentsusers have commented on this narrative
34 likesusers have liked this narrative
TA


Talos on Voyager Technologies ·
The "Landlord of Orbit" – A Deep Value Play Ahead of the Starlab Era
Fair Value:US$385.291.3% undervalued
68 followersusers have followed this narrative
0 commentsusers have commented on this narrative
6 likesusers have liked this narrative
IV

Ivoed on Uber Technologies ·
Uber’s Valuation Depends On Who Captures The Economics Of Driverless Rides
Fair Value:US$11634.8% undervalued
14 followersusers have followed this narrative
0 commentsusers have commented on this narrative
3 likesusers have liked this narrative
Recently Updated Narratives
LU


LunaRodas on Science Applications International ·
SAIC | Science Applications International: What They Said vs. What They Did
Fair Value:US$119.247.5% overvalued
1 followerusers have followed this narrative
0 commentsusers have commented on this narrative
0 likesusers have liked this narrative
AN

Anthony_Lee on Lotus Technology ·
Tech and Tradition: Lotus Technology’s Compound Formula in Luxury EVs
Fair Value:US$2.5354.5% undervalued
2 followersusers have followed this narrative
5 commentsusers have commented on this narrative
1 likeusers have liked this narrative
EP

Epstein_Research on Dryden Gold ·
Dryden Gold continues to expand & de-risk its flagship Gold Rock project!
Fair Value:CA$173.0% undervalued
1 followerusers have followed this narrative
0 commentsusers have commented on this narrative
0 likesusers have liked this narrative
Popular Narratives
OS


oscargarcia on NVIDIA ·
The company that went from selling GPUs to gamers to becoming the AI arms dealer of the 21st century.
Fair Value:US$28021.2% undervalued
370 followersusers have followed this narrative
9 commentsusers have commented on this narrative
16 likesusers have liked this narrative
JO


John_Eric on MercadoLibre ·
MercadoLibre and the Spreadsheet Trick That Decides Everything
Fair Value:US$7.31k73.5% undervalued
125 followersusers have followed this narrative
3 commentsusers have commented on this narrative
18 likesusers have liked this narrative
CU

CubanEros on Microsoft ·
A wonderful business at reasonable price.
Fair Value:US$419.9120.8% overvalued
215 followersusers have followed this narrative
0 commentsusers have commented on this narrative
9 likesusers have liked this narrative

