Advertisement
- United Kingdom
- /
- Electrical
- /
- LSE:DSCV
How Does discoverIE Group's (LON:DSCV) P/E Compare To Its Industry, After The Share Price Drop?
To the annoyance of some shareholders, discoverIE Group (LON:DSCV) shares are down a considerable 32% in the last month. The recent drop has obliterated the annual return, with the share price now down 4.2% over that longer period.
All else being equal, a share price drop should make a stock more attractive to potential investors. In the long term, share prices tend to follow earnings per share, but in the short term prices bounce around in response to short term factors (which are not always obvious). So, on certain occasions, long term focussed investors try to take advantage of pessimistic expectations to buy shares at a better price. Perhaps the simplest way to get a read on investors' expectations of a business is to look at its Price to Earnings Ratio (PE Ratio). Investors have optimistic expectations of companies with higher P/E ratios, compared to companies with lower P/E ratios.
See our latest analysis for discoverIE Group
How Does discoverIE Group's P/E Ratio Compare To Its Peers?
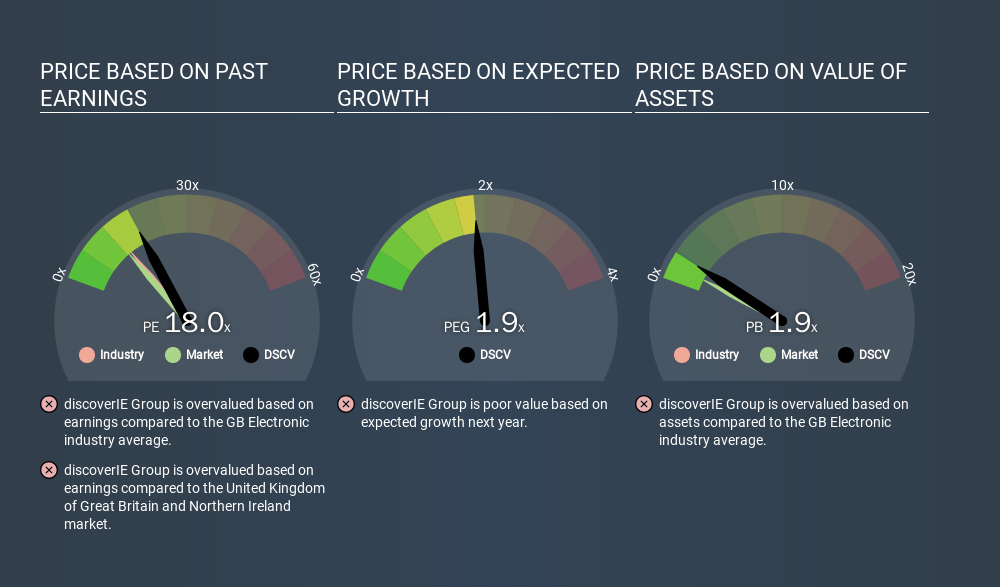
We can tell from its P/E ratio of 17.96 that there is some investor optimism about discoverIE Group. As you can see below, discoverIE Group has a higher P/E than the average company (14.4) in the electronic industry.
discoverIE Group's P/E tells us that market participants think the company will perform better than its industry peers, going forward. Clearly the market expects growth, but it isn't guaranteed. So investors should delve deeper. I like to check if company insiders have been buying or selling.
How Growth Rates Impact P/E Ratios
Generally speaking the rate of earnings growth has a profound impact on a company's P/E multiple. That's because companies that grow earnings per share quickly will rapidly increase the 'E' in the equation. That means even if the current P/E is high, it will reduce over time if the share price stays flat. So while a stock may look expensive based on past earnings, it could be cheap based on future earnings.
It's nice to see that discoverIE Group grew EPS by a stonking 42% in the last year. And it has bolstered its earnings per share by 77% per year over the last five years. So we'd generally expect it to have a relatively high P/E ratio.
Remember: P/E Ratios Don't Consider The Balance Sheet
One drawback of using a P/E ratio is that it considers market capitalization, but not the balance sheet. In other words, it does not consider any debt or cash that the company may have on the balance sheet. Theoretically, a business can improve its earnings (and produce a lower P/E in the future) by investing in growth. That means taking on debt (or spending its cash).
Spending on growth might be good or bad a few years later, but the point is that the P/E ratio does not account for the option (or lack thereof).
discoverIE Group's Balance Sheet
Net debt totals 16% of discoverIE Group's market cap. That's enough debt to impact the P/E ratio a little; so keep it in mind if you're comparing it to companies without debt.
The Verdict On discoverIE Group's P/E Ratio
discoverIE Group's P/E is 18.0 which is above average (11.9) in its market. Its debt levels do not imperil its balance sheet and its EPS growth is very healthy indeed. So on this analysis a high P/E ratio seems reasonable. Given discoverIE Group's P/E ratio has declined from 26.6 to 18.0 in the last month, we know for sure that the market is significantly less confident about the business today, than it was back then. For those who prefer to invest with the flow of momentum, that might be a bad sign, but for a contrarian, it may signal opportunity.
When the market is wrong about a stock, it gives savvy investors an opportunity. As value investor Benjamin Graham famously said, 'In the short run, the market is a voting machine but in the long run, it is a weighing machine. So this free visual report on analyst forecasts could hold the key to an excellent investment decision.
But note: discoverIE Group may not be the best stock to buy. So take a peek at this free list of interesting companies with strong recent earnings growth (and a P/E ratio below 20).
If you spot an error that warrants correction, please contact the editor at editorial-team@simplywallst.com. This article by Simply Wall St is general in nature. It does not constitute a recommendation to buy or sell any stock, and does not take account of your objectives, or your financial situation. Simply Wall St has no position in the stocks mentioned.
We aim to bring you long-term focused research analysis driven by fundamental data. Note that our analysis may not factor in the latest price-sensitive company announcements or qualitative material. Thank you for reading.
About LSE:DSCV
discoverIE Group
Designs, manufactures, and supplies specialist electronic components for industrial applications in the United Kingdom, Europe, North America, Asia, and internationally.
Excellent balance sheet with proven track record.
Market Insights


Advertisement
Weekly Picks
LO


Lou_Basenese on Virtuix Holdings ·
From a “Shark Tank” Snub to an Air Force “Yes”: Why Virtuix at $3.50 May Be the Market’s Most Mispriced AI Story
Fair Value:US$7.556.7% undervalued
34 followersusers have followed this narrative
0 commentsusers have commented on this narrative
6 likesusers have liked this narrative
HE


HedgeY on IonQ ·
The Best-Funded Quantum Platform and Still a Stock Priced for Perfection
Fair Value:US$487.1% overvalued
23 followersusers have followed this narrative
0 commentsusers have commented on this narrative
4 likesusers have liked this narrative
BL


BlackGoat on Cerebras Systems ·
The Wafer Giant Threatening NVIDIA's GPU Hegemony
Fair Value:US$415.5446.8% undervalued
36 followersusers have followed this narrative
1 commentusers have commented on this narrative
7 likesusers have liked this narrative
IV

Ivoed on Netflix ·
Netflix’s Business Quality Is Clear. The Harder Question Is Whether The Stock Is Still Cheap
Fair Value:US$829.5% undervalued
20 followersusers have followed this narrative
0 commentsusers have commented on this narrative
7 likesusers have liked this narrative
Recently Updated Narratives
BR

Bravosatya on Meta Platforms ·
Meta Platforms - Zuckerberg’s investment decisions are impulsive or Prudent?
Fair Value:US$730.0216.0% undervalued
2 followersusers have followed this narrative
0 commentsusers have commented on this narrative
0 likesusers have liked this narrative
JU

julio on FIGS ·
Figs valuation
Fair Value:US$14.3930.2% undervalued
20 followersusers have followed this narrative
6 commentsusers have commented on this narrative
0 likesusers have liked this narrative
AS


AstrisCorporateAdvisory on MIRAI ·
Improving NOI growth visibility on wider rent gap
Fair Value:JP¥77.06k46.1% undervalued
1 followerusers have followed this narrative
0 commentsusers have commented on this narrative
0 likesusers have liked this narrative
Popular Narratives
IN


Investingwilly on Mastercard ·
Mastercard: The Best Dividend Stock You're Ignoring
Fair Value:US$75030.3% undervalued
80 followersusers have followed this narrative
1 commentusers have commented on this narrative
9 likesusers have liked this narrative
HA


HarishPK on Adobe ·
Adobe: A Probabilistic Case for Undervaluation
Fair Value:US$319.9634.1% undervalued
62 followersusers have followed this narrative
9 commentsusers have commented on this narrative
19 likesusers have liked this narrative
MA


martinarauz on Nu Holdings ·
Investment Analysis (May 2026)
Fair Value:US$22.7441.1% undervalued
68 followersusers have followed this narrative
0 commentsusers have commented on this narrative
17 likesusers have liked this narrative