Advertisement
- United Kingdom
- /
- Construction
- /
- LSE:KLR
Here's What You Should Know About Keller Group plc's (LON:KLR) 4.4% Dividend Yield
Is Keller Group plc (LON:KLR) a good dividend stock? How can we tell? Dividend paying companies with growing earnings can be highly rewarding in the long term. If you are hoping to live on your dividends, it's important to be more stringent with your investments than the average punter. Regular readers know we like to apply the same approach to each dividend stock, and we hope you'll find our analysis useful.
A high yield and a long history of paying dividends is an appealing combination for Keller Group. We'd guess that plenty of investors have purchased it for the income. Remember though, due to the recent spike in its share price, Keller Group's yield will look lower, even though the market may now be factoring in an improvement in its long-term prospects. Before you buy any stock for its dividend however, you should always remember Warren Buffett's two rules: 1) Don't lose money, and 2) Remember rule #1. We'll run through some checks below to help with this.
Click the interactive chart for our full dividend analysis
Payout ratios
Dividends are usually paid out of company earnings. If a company is paying more than it earns, then the dividend might become unsustainable - hardly an ideal situation. So we need to form a view on if a company's dividend is sustainable, relative to its net profit after tax. While Keller Group pays a dividend, it reported a loss over the last year. When a company is loss-making, we next need to check to see if its cash flows can support the dividend.
Keller Group's cash payout ratio in the last year was 39%, which suggests dividends were well covered by cash generated by the business.
Is Keller Group's Balance Sheet Risky?
Given Keller Group is paying a dividend but reported a loss over the past year, we need to check its balance sheet for signs of financial distress. A quick check of its financial situation can be done with two ratios: net debt divided by EBITDA (earnings before interest, tax, depreciation and amortisation), and net interest cover. Net debt to EBITDA measures total debt load relative to company earnings (lower = less debt), while net interest cover measures the ability to pay interest on the debt (higher = greater ability to pay interest costs). With net debt of 1.96 times its EBITDA, Keller Group has an acceptable level of debt.
We calculated its interest cover by measuring its earnings before interest and tax (EBIT), and dividing this by the company's net interest expense. Interest cover of 4.95 times its interest expense is starting to become a concern for Keller Group, and be aware that lenders may place additional restrictions on the company as well.
Remember, you can always get a snapshot of Keller Group's latest financial position, by checking our visualisation of its financial health.
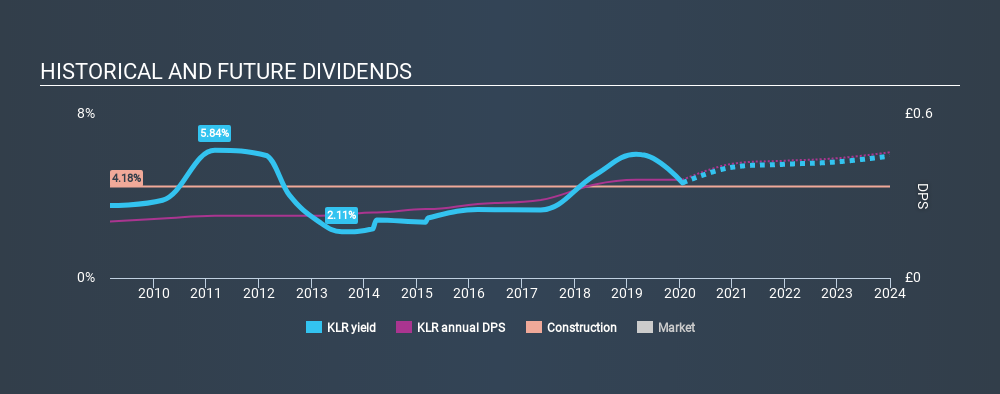
Dividend Volatility
Before buying a stock for its income, we want to see if the dividends have been stable in the past, and if the company has a track record of maintaining its dividend. Keller Group has been paying dividends for a long time, but for the purpose of this analysis, we only examine the past 10 years of payments. During this period the dividend has been stable, which could imply the business could have relatively consistent earnings power. During the past ten-year period, the first annual payment was UK£0.21 in 2010, compared to UK£0.36 last year. Dividends per share have grown at approximately 5.7% per year over this time.
Businesses that can grow their dividends at a decent rate and maintain a stable payout can generate substantial wealth for shareholders over the long term.
Dividend Growth Potential
Dividend payments have been consistent over the past few years, but we should always check if earnings per share (EPS) are growing, as this will help maintain the purchasing power of the dividend. Keller Group has grown its earnings per share at 4.8% per annum over the past five years. Keller Group is paying out less than half of its earnings, which we like. Earnings per share growth have grown slowly, which is not great, but if the retained earnings can be reinvested effectively, future growth may be stronger.
Conclusion
To summarise, shareholders should always check that Keller Group's dividends are affordable, that its dividend payments are relatively stable, and that it has decent prospects for growing its earnings and dividend. We're a bit uncomfortable with the company paying a dividend while being loss-making, although at least the dividend was covered by free cash flow. Second, earnings growth has been mediocre, but at least the dividends have been relatively stable. While we're not hugely bearish on it, overall we think there are potentially better dividend stocks than Keller Group out there.
Earnings growth generally bodes well for the future value of company dividend payments. See if the 6 Keller Group analysts we track are forecasting continued growth with our free report on analyst estimates for the company.
Looking for more high-yielding dividend ideas? Try our curated list of dividend stocks with a yield above 3%.
If you spot an error that warrants correction, please contact the editor at editorial-team@simplywallst.com. This article by Simply Wall St is general in nature. It does not constitute a recommendation to buy or sell any stock, and does not take account of your objectives, or your financial situation. Simply Wall St has no position in the stocks mentioned.
We aim to bring you long-term focused research analysis driven by fundamental data. Note that our analysis may not factor in the latest price-sensitive company announcements or qualitative material. Thank you for reading.
About LSE:KLR
Keller Group
Provides specialist geotechnical services in North America, Europe, the Middle East, and the Asia-Pacific.
Flawless balance sheet established dividend payer.
Similar Companies
Market Insights


Advertisement
Weekly Picks
CE


Ceazar on Sparc AI ·
When GPS fails: this small cap is fixing a $54B drone problem
Fair Value:CA$5.2540.2% undervalued
95 followersusers have followed this narrative
0 commentsusers have commented on this narrative
23 likesusers have liked this narrative
HA


HarishPK on lululemon athletica ·
Quantifying the Transition: Why Lululemon’s Moat Remains Intact
Fair Value:US$161.828.5% undervalued
5 followersusers have followed this narrative
0 commentsusers have commented on this narrative
5 likesusers have liked this narrative
TR


tripledub on Alphabet ·
Warren Buffett Just Bet $10 Billion on Google. The Catch? You May Already Be Too Late.
Fair Value:US$23059.3% overvalued
37 followersusers have followed this narrative
1 commentusers have commented on this narrative
9 likesusers have liked this narrative
JO


John_Eric on Veeva Systems ·
AI-Powered Veeva Systems Poised for Solid Growth Amid Regulatory Stability
Fair Value:US$32040.0% undervalued
7 followersusers have followed this narrative
0 commentsusers have commented on this narrative
0 likesusers have liked this narrative
Recently Updated Narratives
RO


RockeTeller on Revival Gold ·
7,000% US Based Idaho & Utah Gold Miner Play, Beartrack + Mercur: $1.2B+ NAV Leverage with Strong Management
Fair Value:CA$12.7194.4% undervalued
9 followersusers have followed this narrative
1 commentusers have commented on this narrative
0 likesusers have liked this narrative
NO

NordicWolf on Carlsberg ·
Defensive Beverage Compounder With Britvic Upside
Fair Value:DKK 870.329.4% overvalued
2 followersusers have followed this narrative
0 commentsusers have commented on this narrative
0 likesusers have liked this narrative
DA


DaneDruss on Cloudflare ·
Q-Day: Quantum Hype vs Quantum-Safe Infrastructure
Fair Value:US$167.4547.8% overvalued
2 followersusers have followed this narrative
0 commentsusers have commented on this narrative
0 likesusers have liked this narrative
Popular Narratives
IN


Investingwilly on Mastercard ·
Mastercard: The Best Dividend Stock You're Ignoring
Fair Value:US$75028.9% undervalued
84 followersusers have followed this narrative
1 commentusers have commented on this narrative
9 likesusers have liked this narrative
HA

HarishPK on Adobe ·
Adobe: A Probabilistic Case for Undervaluation
Fair Value:US$319.9631.8% undervalued
64 followersusers have followed this narrative
9 commentsusers have commented on this narrative
19 likesusers have liked this narrative
BL


BlackGoat on Cerebras Systems ·
The Wafer Giant Threatening NVIDIA's GPU Hegemony
Fair Value:US$415.5453.8% undervalued
58 followersusers have followed this narrative
1 commentusers have commented on this narrative
10 likesusers have liked this narrative
Trending Discussion


MW

mwod31 on Greatland Resources ·
A great comment, WSB have not done the research imo. I intend to buy more shares in 2026.
0
|0