Advertisement
Here's What Max Financial Services Limited's (NSE:MFSL) P/E Ratio Is Telling Us
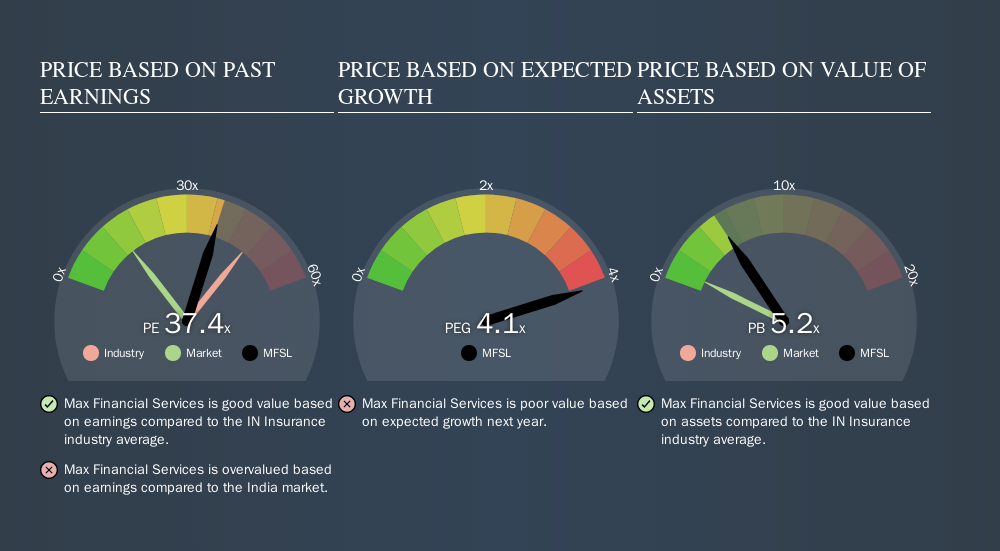
This article is written for those who want to get better at using price to earnings ratios (P/E ratios). We'll look at Max Financial Services Limited's (NSE:MFSL) P/E ratio and reflect on what it tells us about the company's share price. Max Financial Services has a P/E ratio of 37.45, based on the last twelve months. In other words, at today's prices, investors are paying ₹37.45 for every ₹1 in prior year profit.
View our latest analysis for Max Financial Services
How Do You Calculate Max Financial Services's P/E Ratio?
The formula for P/E is:
Price to Earnings Ratio = Price per Share ÷ Earnings per Share (EPS)
Or for Max Financial Services:
P/E of 37.45 = ₹399.35 ÷ ₹10.66 (Based on the year to June 2019.)
Is A High P/E Ratio Good?
A higher P/E ratio means that investors are paying a higher price for each ₹1 of company earnings. That is not a good or a bad thing per se, but a high P/E does imply buyers are optimistic about the future.
Does Max Financial Services Have A Relatively High Or Low P/E For Its Industry?
One good way to get a quick read on what market participants expect of a company is to look at its P/E ratio. The image below shows that Max Financial Services has a lower P/E than the average (47.6) P/E for companies in the insurance industry.
Max Financial Services's P/E tells us that market participants think it will not fare as well as its peers in the same industry. Since the market seems unimpressed with Max Financial Services, it's quite possible it could surprise on the upside. You should delve deeper. I like to check if company insiders have been buying or selling.
How Growth Rates Impact P/E Ratios
Earnings growth rates have a big influence on P/E ratios. When earnings grow, the 'E' increases, over time. Therefore, even if you pay a high multiple of earnings now, that multiple will become lower in the future. So while a stock may look expensive based on past earnings, it could be cheap based on future earnings.
Max Financial Services's earnings per share were pretty steady over the last year. But it has grown its earnings per share by 15% per year over the last five years.
A Limitation: P/E Ratios Ignore Debt and Cash In The Bank
It's important to note that the P/E ratio considers the market capitalization, not the enterprise value. That means it doesn't take debt or cash into account. Theoretically, a business can improve its earnings (and produce a lower P/E in the future) by investing in growth. That means taking on debt (or spending its cash).
Such spending might be good or bad, overall, but the key point here is that you need to look at debt to understand the P/E ratio in context.
So What Does Max Financial Services's Balance Sheet Tell Us?
Since Max Financial Services holds net cash of ₹5.1b, it can spend on growth, justifying a higher P/E ratio than otherwise.
The Verdict On Max Financial Services's P/E Ratio
Max Financial Services's P/E is 37.4 which is above average (13.6) in its market. Earnings improved over the last year. Also positive, the relatively strong balance sheet will allow for investment in growth -- and the P/E indicates shareholders that will happen!
Investors should be looking to buy stocks that the market is wrong about. If the reality for a company is better than it expects, you can make money by buying and holding for the long term. So this free report on the analyst consensus forecasts could help you make a master move on this stock.
Of course, you might find a fantastic investment by looking at a few good candidates. So take a peek at this free list of companies with modest (or no) debt, trading on a P/E below 20.
We aim to bring you long-term focused research analysis driven by fundamental data. Note that our analysis may not factor in the latest price-sensitive company announcements or qualitative material.
If you spot an error that warrants correction, please contact the editor at editorial-team@simplywallst.com. This article by Simply Wall St is general in nature. It does not constitute a recommendation to buy or sell any stock, and does not take account of your objectives, or your financial situation. Simply Wall St has no position in the stocks mentioned. Thank you for reading.
About NSEI:MFSL
Max Financial Services
Through its subsidiary, engages in life insurance business in India.
Reasonable growth potential and fair value.
Market Insights

Advertisement
Weekly Picks
DA


davidlsander on Nevgold ·
The U.S. Government Is Desperate for This Metal. This Tiny Miner Has It -- Its Closest Peer Is Already Worth Double.
Fair Value:US$2.1943.7% undervalued
49 followersusers have followed this narrative
0 commentsusers have commented on this narrative
5 likesusers have liked this narrative
WE


WealthAP on Novo Nordisk ·
Novo Nordisk (NVO): Is the "Easy Growth" Story Over?
Fair Value:DKK 407.7720.5% undervalued
27 followersusers have followed this narrative
0 commentsusers have commented on this narrative
2 likesusers have liked this narrative
VA


ValueInvestingSubstack on Zoetis ·
Zoetis down -50% over the past year
Fair Value:US$92.9218.9% undervalued
9 followersusers have followed this narrative
0 commentsusers have commented on this narrative
4 likesusers have liked this narrative
CE


CentryResearch on Centrus Energy ·
Centrus Energy: The Next Nuclear Bottleneck Isn't Reactors. It's Fuel.
Fair Value:US$1909.9% undervalued
1 followerusers have followed this narrative
0 commentsusers have commented on this narrative
2 likesusers have liked this narrative
Recently Updated Narratives
OO

OOO97 on QXO ·
QXO aims for $24B revenue by 2031 with AI-driven margin expansion (Priced for good execution)
Fair Value:US$32.5357.1% undervalued
16 followersusers have followed this narrative
0 commentsusers have commented on this narrative
0 likesusers have liked this narrative
DA

danmad on Sonic Healthcare ·
Sonic Healthcare is poised for large upside as margins recover
Fair Value:AU$2721.8% undervalued
1 followerusers have followed this narrative
0 commentsusers have commented on this narrative
0 likesusers have liked this narrative
CE

CentryResearch on DraftKings ·
DraftKings: Priced for Pessimism, But Are the Risks Fully Priced In?
Fair Value:US$20.9713.7% overvalued
1 followerusers have followed this narrative
0 commentsusers have commented on this narrative
0 likesusers have liked this narrative
Popular Narratives
IN


Investingwilly on Mastercard ·
Mastercard: The Best Dividend Stock You're Ignoring
Fair Value:US$75028.2% undervalued
98 followersusers have followed this narrative
1 commentusers have commented on this narrative
9 likesusers have liked this narrative
BE

benjamin_lvieq on PayPal Holdings ·
PayPal: PayPal Doesn't Need to Grow – It Needs to Stop Falling – A Mispriced Cash Machine With a Cannibal Buyback
Fair Value:US$6514.1% undervalued
67 followersusers have followed this narrative
2 commentsusers have commented on this narrative
10 likesusers have liked this narrative
BL


BlackGoat on Cerebras Systems ·
The Wafer Giant Threatening NVIDIA's GPU Hegemony
Fair Value:US$415.5449.8% undervalued
64 followersusers have followed this narrative
3 commentsusers have commented on this narrative
11 likesusers have liked this narrative
Trending Discussion
BE
benjamin_lvieq on PayPal Holdings ·
An investment case is not about loving the product. Its about price vs reality.
2
|0
ST


StoxEurope on Koninklijke Ahold Delhaize ·
I ran Ahold Delhaize through a three-model triangulation — DCF, dividend discount, and residual inco...
1
|0