
Advertisement
- United States
- /
- Banks
- /
- NasdaqGM:AMAL
Here's What Amalgamated Bank's (NASDAQ:AMAL) P/E Ratio Is Telling Us

This article is for investors who would like to improve their understanding of price to earnings ratios (P/E ratios). We'll show how you can use Amalgamated Bank's (NASDAQ:AMAL) P/E ratio to inform your assessment of the investment opportunity. Looking at earnings over the last twelve months, Amalgamated Bank has a P/E ratio of 12.01. That is equivalent to an earnings yield of about 8.3%.
See our latest analysis for Amalgamated Bank
How Do I Calculate A Price To Earnings Ratio?
The formula for price to earnings is:
Price to Earnings Ratio = Price per Share ÷ Earnings per Share (EPS)
Or for Amalgamated Bank:
P/E of 12.01 = USD17.90 ÷ USD1.49 (Based on the year to December 2019.)
Is A High Price-to-Earnings Ratio Good?
The higher the P/E ratio, the higher the price tag of a business, relative to its trailing earnings. That is not a good or a bad thing per se, but a high P/E does imply buyers are optimistic about the future.
Does Amalgamated Bank Have A Relatively High Or Low P/E For Its Industry?
The P/E ratio essentially measures market expectations of a company. The image below shows that Amalgamated Bank has a P/E ratio that is roughly in line with the banks industry average (12.5).
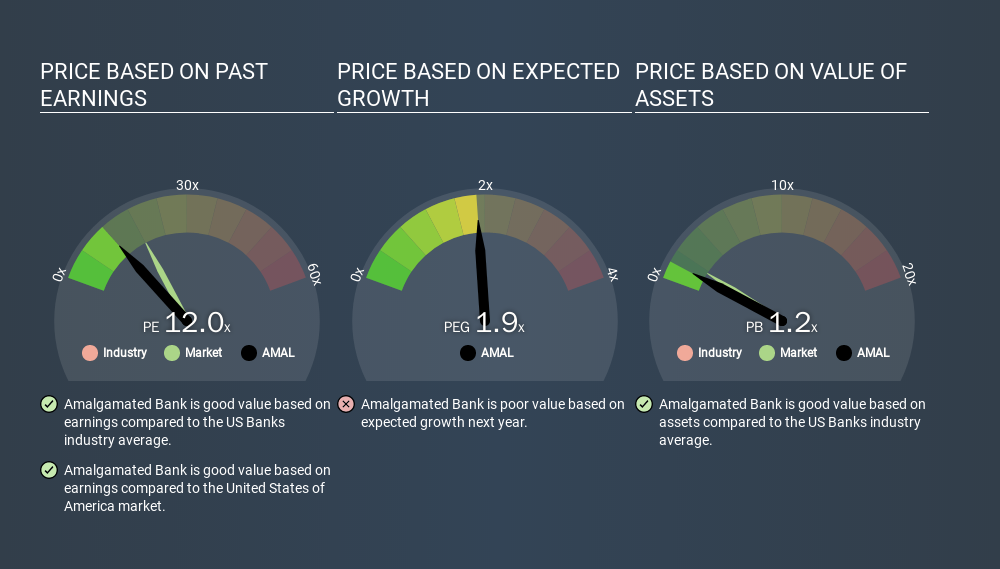
Amalgamated Bank's P/E tells us that market participants think its prospects are roughly in line with its industry. If the company has better than average prospects, then the market might be underestimating it. I would further inform my view by checking insider buying and selling., among other things.
How Growth Rates Impact P/E Ratios
Probably the most important factor in determining what P/E a company trades on is the earnings growth. Earnings growth means that in the future the 'E' will be higher. And in that case, the P/E ratio itself will drop rather quickly. So while a stock may look expensive based on past earnings, it could be cheap based on future earnings.
Amalgamated Bank's earnings per share were pretty steady over the last year. But it has grown its earnings per share by 32% per year over the last five years.
Remember: P/E Ratios Don't Consider The Balance Sheet
Don't forget that the P/E ratio considers market capitalization. So it won't reflect the advantage of cash, or disadvantage of debt. In theory, a company can lower its future P/E ratio by using cash or debt to invest in growth.
Such expenditure might be good or bad, in the long term, but the point here is that the balance sheet is not reflected by this ratio.
So What Does Amalgamated Bank's Balance Sheet Tell Us?
The extra options and safety that comes with Amalgamated Bank's US$48m net cash position means that it deserves a higher P/E than it would if it had a lot of net debt.
The Bottom Line On Amalgamated Bank's P/E Ratio
Amalgamated Bank trades on a P/E ratio of 12.0, which is below the US market average of 18.2. Earnings improved over the last year. And the healthy balance sheet means the company can sustain growth while the P/E suggests shareholders don't think it will.
When the market is wrong about a stock, it gives savvy investors an opportunity. As value investor Benjamin Graham famously said, 'In the short run, the market is a voting machine but in the long run, it is a weighing machine. So this free report on the analyst consensus forecasts could help you make a master move on this stock.
But note: Amalgamated Bank may not be the best stock to buy. So take a peek at this free list of interesting companies with strong recent earnings growth (and a P/E ratio below 20).
If you spot an error that warrants correction, please contact the editor at editorial-team@simplywallst.com. This article by Simply Wall St is general in nature. It does not constitute a recommendation to buy or sell any stock, and does not take account of your objectives, or your financial situation. Simply Wall St has no position in the stocks mentioned.
We aim to bring you long-term focused research analysis driven by fundamental data. Note that our analysis may not factor in the latest price-sensitive company announcements or qualitative material. Thank you for reading.
About NasdaqGM:AMAL
Amalgamated Financial
Operates as the bank holding company for Amalgamated Bank that provides commercial and retail banking, investment management, and trust and custody services in the United States.
Flawless balance sheet and undervalued.
Similar Companies
Market Insights


Advertisement
Community Narratives
The Future of Drug Testing? Fingerprint Tech Shows Serious Promise
Fair Value US$2.98|40.3% undervalued
JO
Community Contributor
Suncorp’s Next Chapter: Insurance-Only and Ready to Grow
Fair Value AU$22.83|7.9% undervalued
RO
Community Contributor
Thyssenkrupp Nucera Will Achieve Double-Digit Profits by 2030 Boosted by Hydrogen Growth
Fair Value €14.40|31.6% undervalued
CH
Community Contributor
Tesla’s Nvidia Moment – The AI & Robotics Inflection Point
Fair Value US$359.72|12.3% undervalued
BL
Community Contributor