Advertisement
- United States
- /
- Packaging
- /
- NYSE:SLGN
Here's How P/E Ratios Can Help Us Understand Silgan Holdings Inc. (NASDAQ:SLGN)
This article is written for those who want to get better at using price to earnings ratios (P/E ratios). To keep it practical, we'll show how Silgan Holdings Inc.'s (NASDAQ:SLGN) P/E ratio could help you assess the value on offer. Based on the last twelve months, Silgan Holdings's P/E ratio is 17.76. That means that at current prices, buyers pay $17.76 for every $1 in trailing yearly profits.
View our latest analysis for Silgan Holdings
How Do You Calculate A P/E Ratio?
The formula for P/E is:
Price to Earnings Ratio = Share Price ÷ Earnings per Share (EPS)
Or for Silgan Holdings:
P/E of 17.76 = USD31.57 ÷ USD1.78 (Based on the trailing twelve months to September 2019.)
Is A High P/E Ratio Good?
A higher P/E ratio means that investors are paying a higher price for each USD1 of company earnings. That is not a good or a bad thing per se, but a high P/E does imply buyers are optimistic about the future.
How Does Silgan Holdings's P/E Ratio Compare To Its Peers?
We can get an indication of market expectations by looking at the P/E ratio. You can see in the image below that the average P/E (18.8) for companies in the packaging industry is roughly the same as Silgan Holdings's P/E.
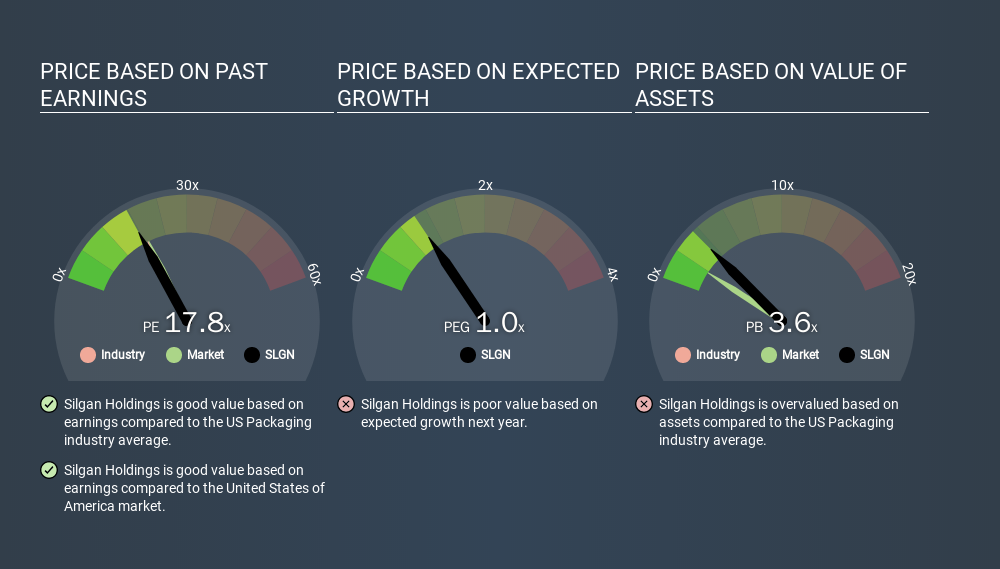
Silgan Holdings's P/E tells us that market participants think its prospects are roughly in line with its industry. The company could surprise by performing better than average, in the future. I would further inform my view by checking insider buying and selling., among other things.
How Growth Rates Impact P/E Ratios
P/E ratios primarily reflect market expectations around earnings growth rates. If earnings are growing quickly, then the 'E' in the equation will increase faster than it would otherwise. That means unless the share price increases, the P/E will reduce in a few years. Then, a lower P/E should attract more buyers, pushing the share price up.
Silgan Holdings's earnings per share fell by 41% in the last twelve months. But EPS is up 4.4% over the last 5 years.
Don't Forget: The P/E Does Not Account For Debt or Bank Deposits
The 'Price' in P/E reflects the market capitalization of the company. Thus, the metric does not reflect cash or debt held by the company. Theoretically, a business can improve its earnings (and produce a lower P/E in the future) by investing in growth. That means taking on debt (or spending its cash).
Such spending might be good or bad, overall, but the key point here is that you need to look at debt to understand the P/E ratio in context.
So What Does Silgan Holdings's Balance Sheet Tell Us?
Silgan Holdings has net debt worth 72% of its market capitalization. If you want to compare its P/E ratio to other companies, you should absolutely keep in mind it has significant borrowings.
The Bottom Line On Silgan Holdings's P/E Ratio
Silgan Holdings trades on a P/E ratio of 17.8, which is fairly close to the US market average of 19.0. With meaningful debt, and no earnings per share growth last year, even an average P/E indicates that the market a significant improvement from the business.
Investors have an opportunity when market expectations about a stock are wrong. If it is underestimating a company, investors can make money by buying and holding the shares until the market corrects itself. So this free visualization of the analyst consensus on future earnings could help you make the right decision about whether to buy, sell, or hold.
Of course you might be able to find a better stock than Silgan Holdings. So you may wish to see this free collection of other companies that have grown earnings strongly.
If you spot an error that warrants correction, please contact the editor at editorial-team@simplywallst.com. This article by Simply Wall St is general in nature. It does not constitute a recommendation to buy or sell any stock, and does not take account of your objectives, or your financial situation. Simply Wall St has no position in the stocks mentioned.
We aim to bring you long-term focused research analysis driven by fundamental data. Note that our analysis may not factor in the latest price-sensitive company announcements or qualitative material. Thank you for reading.
About NYSE:SLGN
Silgan Holdings
Manufactures and sells rigid packaging solutions for consumer goods products in the United States and internationally.
Very undervalued established dividend payer.
Similar Companies
Market Insights


Advertisement
Weekly Picks
CE


Ceazar on Conexeu Sciences ·
This small biotech is developing technology that could potentially change how tissue is rebuilt
Fair Value:US$25.3447.6% undervalued
26 followersusers have followed this narrative
0 commentsusers have commented on this narrative
3 likesusers have liked this narrative
HE


HedgeY on Quanta Services ·
The Picks-and-Shovels Leader of the Grid Supercycle
Fair Value:US$7101.1% undervalued
48 followersusers have followed this narrative
0 commentsusers have commented on this narrative
4 likesusers have liked this narrative
FU

FundamentalFlow on Karman Holdings ·
KRMN — Karman Space & Defense: Down 58% from Peak, Is the Market Mispricing a Hypergrowth Defense Compounder?
Fair Value:US$105.652.3% undervalued
28 followersusers have followed this narrative
2 commentsusers have commented on this narrative
13 likesusers have liked this narrative
DO


Double_Bubbler on Invinity Energy Systems ·
Invinity Energy Systems: All About That BESS
Fair Value:UK£161.8% undervalued
36 followersusers have followed this narrative
0 commentsusers have commented on this narrative
5 likesusers have liked this narrative
Recently Updated Narratives
HU

Hunter_Z on EPB Group Berhad ·
EPB: Strong Shareholder Backing, Continuous Insider Buying and Growth Opportunities Ahead
Fair Value:RM 0.548.0% undervalued
1 followerusers have followed this narrative
0 commentsusers have commented on this narrative
0 likesusers have liked this narrative
YO
youwakeup on Harvest Strategy Enhanced High Income Shares ETF ·
MSTE: Turning Bitcoin Volatility Into Monthly Cash Flow
Fair Value:CA$11.7579.6% undervalued
1 followerusers have followed this narrative
0 commentsusers have commented on this narrative
0 likesusers have liked this narrative
ES

Ester on Agricore CS Holdings Berhad ·
Agricore CS Holdings Is Riding on Regional Growth Through Defensible Food Ingredient Supply Chains
Fair Value:RM 0.6841.2% undervalued
1 followerusers have followed this narrative
0 commentsusers have commented on this narrative
0 likesusers have liked this narrative
Popular Narratives
MA


martinarauz on Nu Holdings ·
Investment Analysis (May 2026)
Fair Value:US$22.7444.1% undervalued
68 followersusers have followed this narrative
0 commentsusers have commented on this narrative
16 likesusers have liked this narrative
HA


HarishPK on Adobe ·
Adobe: A Probabilistic Case for Undervaluation
Fair Value:US$319.9639.0% undervalued
57 followersusers have followed this narrative
9 commentsusers have commented on this narrative
17 likesusers have liked this narrative
NI


niteco on Honeywell International ·
Honeywell - The Demand-Side of the AI Infrastructure
Fair Value:US$320.1928.5% undervalued
52 followersusers have followed this narrative
0 commentsusers have commented on this narrative
19 likesusers have liked this narrative


