
Advertisement
Force Motors Limited's (NSE:FORCEMOT) Share Price Not Quite Adding Up
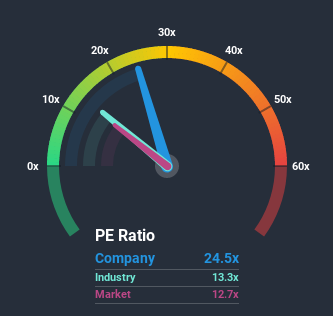
With a price-to-earnings (or "P/E") ratio of 24.5x Force Motors Limited (NSE:FORCEMOT) may be sending very bearish signals at the moment, given that almost half of all companies in India have P/E ratios under 12x and even P/E's lower than 6x are not unusual. Although, it's not wise to just take the P/E at face value as there may be an explanation why it's so lofty.
For example, consider that Force Motors' financial performance has been poor lately as it's earnings have been in decline. One possibility is that the P/E is high because investors think the company will still do enough to outperform the broader market in the near future. You'd really hope so, otherwise you're paying a pretty hefty price for no particular reason.
Check out our latest analysis for Force Motors
Where Does Force Motors' P/E Sit Within Its Industry?
We'd like to see if P/E's within Force Motors' industry might provide some colour around the company's particularly high P/E ratio. It turns out the Machinery industry in general has a P/E ratio similar to the market, as the graphic below shows. So unfortunately this doesn't provide a lot to explain the company's ratio right now. In the context of the Machinery industry's current setting, most of its constituents' P/E's would be expected to be held back. We'd highlight though, the spotlight should be on the anticipated direction of the company's earnings.
What Are Growth Metrics Telling Us About The High P/E?
In order to justify its P/E ratio, Force Motors would need to produce outstanding growth well in excess of the market.
Retrospectively, the last year delivered a frustrating 65% decrease to the company's bottom line. As a result, earnings from three years ago have also fallen 72% overall. Therefore, it's fair to say the earnings growth recently has been undesirable for the company.
This is in contrast to the rest of the market, which is expected to decline by 4.8% over the next year, or less than the company's recent medium-term annualised earnings decline.
With this information, it's strange that Force Motors is trading at a higher P/E in comparison. With earnings going quickly in reverse, it's not guaranteed that the P/E has found a floor yet. There's potential for the P/E to fall to lower levels if the company doesn't improve its profitability, which would be difficult to do with the current market outlook.
What We Can Learn From Force Motors' P/E?
The price-to-earnings ratio's power isn't primarily as a valuation instrument but rather to gauge current investor sentiment and future expectations.
We've established that Force Motors currently trades on a much higher than expected P/E since its recent three-year earnings are even worse than the forecasts for a struggling market. When we see below average earnings, we suspect the share price is at risk of declining, sending the high P/E lower. In addition, we would be concerned whether the company can even maintain its medium-term level of performance under these tough market conditions. This would place shareholders' investments at significant risk and potential investors in danger of paying an excessive premium.
It's always necessary to consider the ever-present spectre of investment risk. We've identified 4 warning signs with Force Motors (at least 1 which is a bit concerning), and understanding them should be part of your investment process.
If these risks are making you reconsider your opinion on Force Motors, explore our interactive list of high quality stocks to get an idea of what else is out there.
When trading Force Motors or any other investment, use the platform considered by many to be the Professional's Gateway to the Worlds Market, Interactive Brokers. You get the lowest-cost* trading on stocks, options, futures, forex, bonds and funds worldwide from a single integrated account. Promoted
New: AI Stock Screener & Alerts
Our new AI Stock Screener scans the market every day to uncover opportunities.
• Dividend Powerhouses (3%+ Yield)
• Undervalued Small Caps with Insider Buying
• High growth Tech and AI Companies
Or build your own from over 50 metrics.
This article by Simply Wall St is general in nature. It does not constitute a recommendation to buy or sell any stock, and does not take account of your objectives, or your financial situation. We aim to bring you long-term focused analysis driven by fundamental data. Note that our analysis may not factor in the latest price-sensitive company announcements or qualitative material. Simply Wall St has no position in any stocks mentioned.
*Interactive Brokers Rated Lowest Cost Broker by StockBrokers.com Annual Online Review 2020
Have feedback on this article? Concerned about the content? Get in touch with us directly. Alternatively, email editorial-team@simplywallst.com.
About NSEI:FORCEMOT
Force Motors
An integrated automobile company, designs, develops, manufactures, and sells a range of automotive components, aggregates, and vehicles in India.
Flawless balance sheet with solid track record.
Similar Companies
Market Insights

Advertisement
Community Narratives
Quality at a Premium. A time to watch, not to buy?
Fair Value US$154.56|29.9% undervalued
DA
Community Contributor
GRAB: The Super-App at the Heart of Southeast Asia’s Digital Boom
Fair Value US$6.60|4.2% undervalued
BL
Community Contributor
Verve Group to Surge with 51.61% Revenue Growth
Fair Value €6.00|64.1% undervalued
ME
Community Contributor