European Value Stocks Trading At Estimated Discounts In June 2025

Reviewed by Simply Wall St
As European markets navigate a landscape marked by geopolitical tensions and economic uncertainties, the pan-European STOXX Europe 600 Index recently saw a decline of 1.54%, reflecting investor concerns. Amidst this environment, identifying undervalued stocks can offer potential opportunities for investors seeking value; these stocks typically exhibit strong fundamentals or growth prospects that may not yet be fully recognized by the market.
Top 10 Undervalued Stocks Based On Cash Flows In Europe
| Name | Current Price | Fair Value (Est) | Discount (Est) |
| VIGO Photonics (WSE:VGO) | PLN508.00 | PLN1015.69 | 50% |
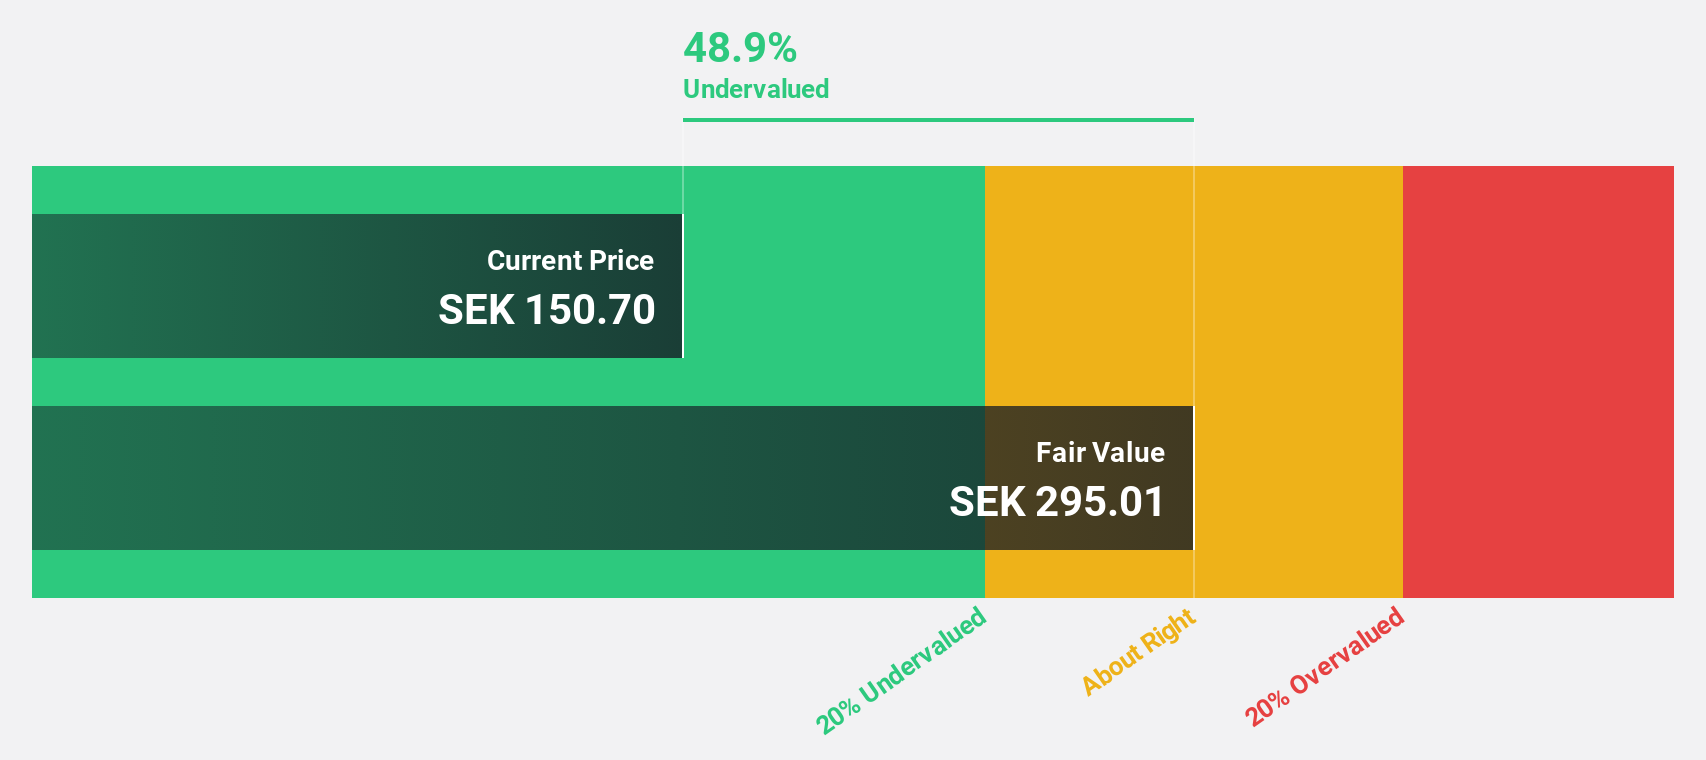
| Sulzer (SWX:SUN) | CHF139.00 | CHF272.17 | 48.9% |
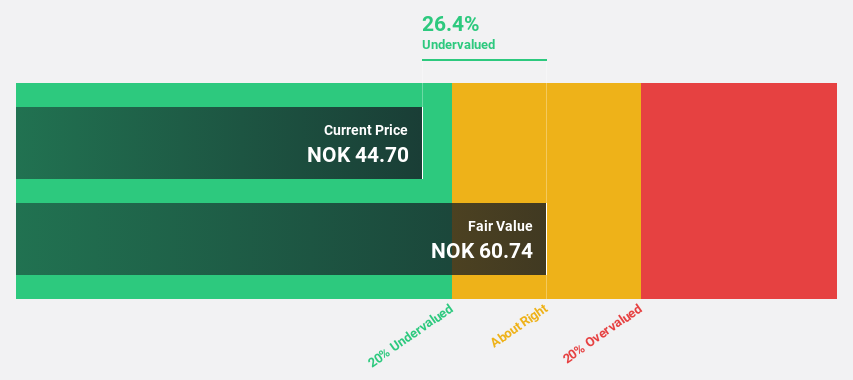
| Sparebank 68° Nord (OB:SB68) | NOK182.98 | NOK357.10 | 48.8% |
| Selvita (WSE:SLV) | PLN29.30 | PLN57.07 | 48.7% |
| Qt Group Oyj (HLSE:QTCOM) | €55.35 | €108.01 | 48.8% |
| PFISTERER Holding (XTRA:PFSE) | €39.40 | €78.30 | 49.7% |
| Koskisen Oyj (HLSE:KOSKI) | €8.86 | €17.37 | 49% |
| dormakaba Holding (SWX:DOKA) | CHF720.00 | CHF1400.05 | 48.6% |
| Absolent Air Care Group (OM:ABSO) | SEK210.00 | SEK416.11 | 49.5% |
| ABO Energy GmbH KGaA (XTRA:AB9) | €36.30 | €70.65 | 48.6% |
Here's a peek at a few of the choices from the screener.
Elopak (OB:ELO)
Overview: Elopak ASA manufactures and supplies paper-based packaging solutions for liquid food across various regions globally, with a market cap of NOK12.43 billion.
Operations: The company's revenue segments are divided into EMEA, generating €872.31 million, and the Americas, contributing €330.40 million.
Estimated Discount To Fair Value: 33.1%
Elopak is trading at 33.1% below its estimated fair value, suggesting it is undervalued based on cash flows. Despite a high level of debt, Elopak's earnings and revenue are forecast to grow faster than the Norwegian market, with expected annual profit growth at 14.4%. Recent earnings show sales increased to €310.24 million, although net income decreased slightly year-over-year. The company also affirmed dividends and completed a share buyback tranche for NOK 21.32 million.
- Our expertly prepared growth report on Elopak implies its future financial outlook may be stronger than recent results.
- Dive into the specifics of Elopak here with our thorough financial health report.
Surgical Science Sweden (OM:SUS)
Overview: Surgical Science Sweden AB (publ) develops and markets virtual reality simulators for evidence-based medical training globally, with a market cap of SEK7.79 billion.
Operations: The company generates revenue from two main segments: Industry/OEM, contributing SEK460.22 million, and Educational Products, accounting for SEK486.31 million.
Estimated Discount To Fair Value: 44.8%
Surgical Science Sweden is trading at SEK152.6, significantly below its estimated fair value of SEK276.63, highlighting its undervaluation based on cash flows. Despite a decline in profit margins from 24.7% to 14.9%, earnings are projected to grow robustly at 32.3% annually, outpacing the Swedish market's growth rate of 14.9%. Recent Q1 results show increased sales and net income year-over-year, with new leadership as Gisli Hennermark becomes Chairman of the Board.
- Our earnings growth report unveils the potential for significant increases in Surgical Science Sweden's future results.
- Unlock comprehensive insights into our analysis of Surgical Science Sweden stock in this financial health report.
Troax Group (OM:TROAX)
Overview: Troax Group AB (publ) manufactures and sells mesh panels across the Nordic region, the United Kingdom, North America, Europe, and internationally with a market cap of SEK8.74 billion.
Operations: The company's revenue is primarily generated from the sale of mesh panels, amounting to €275.94 million.
Estimated Discount To Fair Value: 11.3%
Troax Group, trading at SEK146, is undervalued based on cash flows with a fair value estimate of SEK164.64. Earnings are set to grow faster than the Swedish market at 18.7% annually, while revenue growth is forecasted at 7% per year. Despite recent declines in Q1 sales and net income compared to last year, analysts anticipate a 29.6% rise in stock price. However, its dividend track record remains unstable following the recent EUR0.34 per share declaration.
- Our growth report here indicates Troax Group may be poised for an improving outlook.
- Click here and access our complete balance sheet health report to understand the dynamics of Troax Group.

Turning Ideas Into Actions
- Investigate our full lineup of 185 Undervalued European Stocks Based On Cash Flows right here.
- Are these companies part of your investment strategy? Use Simply Wall St to consolidate your holdings into a portfolio and gain insights with our comprehensive analysis tools.
- Elevate your portfolio with Simply Wall St, the ultimate app for investors seeking global market coverage.
Contemplating Other Strategies?
- Explore high-performing small cap companies that haven't yet garnered significant analyst attention.
- Diversify your portfolio with solid dividend payers offering reliable income streams to weather potential market turbulence.
- Fuel your portfolio with companies showing strong growth potential, backed by optimistic outlooks both from analysts and management.
This article by Simply Wall St is general in nature. We provide commentary based on historical data and analyst forecasts only using an unbiased methodology and our articles are not intended to be financial advice. It does not constitute a recommendation to buy or sell any stock, and does not take account of your objectives, or your financial situation. We aim to bring you long-term focused analysis driven by fundamental data. Note that our analysis may not factor in the latest price-sensitive company announcements or qualitative material. Simply Wall St has no position in any stocks mentioned.
The New Payments ETF Is Live on NASDAQ:
Money is moving to real-time rails, and a newly listed ETF now gives investors direct exposure. Fast settlement. Institutional custody. Simple access.
Explore how this launch could reshape portfolios
Sponsored ContentValuation is complex, but we're here to simplify it.
Discover if Troax Group might be undervalued or overvalued with our detailed analysis, featuring fair value estimates, potential risks, dividends, insider trades, and its financial condition.
Access Free AnalysisHave feedback on this article? Concerned about the content? Get in touch with us directly. Alternatively, email editorial-team@simplywallst.com
About OM:TROAX
Troax Group
Through its subsidiaries, produces and sells mesh panels in the Nordic region, the United Kingdom, North America, Europe, and internationally.
Flawless balance sheet with high growth potential.
Similar Companies
Market Insights

Weekly Picks

THE KINGDOM OF BROWN GOODS: WHY MGPI IS BEING CRUSHED BY INVENTORY & PRIMED FOR RESURRECTION


Why Vertical Aerospace (NYSE: EVTL) is Worth Possibly Over 13x its Current Price


The Quiet Giant That Became AI’s Power Grid
Recently Updated Narratives

Deep Value Multi Bagger Opportunity


A case for CA$31.80 (undiluted), aka 8,616% upside from CA$0.37 (an 86 bagger!).


Unicycive Therapeutics (Nasdaq: UNCY) – Preparing for a Second Shot at Bringing a New Kidney Treatment to Market (TEST)
Popular Narratives


MicroVision will explode future revenue by 380.37% with a vision towards success


NVDA: Expanding AI Demand Will Drive Major Data Center Investments Through 2026


Crazy Undervalued 42 Baggers Silver Play (Active & Running Mine)
Trending Discussion

