Advertisement
Today we'll do a simple run through of a valuation method used to estimate the attractiveness of FDC Limited (NSE:FDC) as an investment opportunity by projecting its future cash flows and then discounting them to today's value. Our analysis will employ the Discounted Cash Flow (DCF) model. Models like these may appear beyond the comprehension of a lay person, but they're fairly easy to follow.
We generally believe that a company's value is the present value of all of the cash it will generate in the future. However, a DCF is just one valuation metric among many, and it is not without flaws. If you want to learn more about discounted cash flow, the rationale behind this calculation can be read in detail in the Simply Wall St analysis model.
See our latest analysis for FDC
Crunching the numbers
We are going to use a two-stage DCF model, which, as the name states, takes into account two stages of growth. The first stage is generally a higher growth period which levels off heading towards the terminal value, captured in the second 'steady growth' period. To begin with, we have to get estimates of the next ten years of cash flows. Where possible we use analyst estimates, but when these aren't available we extrapolate the previous free cash flow (FCF) from the last estimate or reported value. We assume companies with shrinking free cash flow will slow their rate of shrinkage, and that companies with growing free cash flow will see their growth rate slow, over this period. We do this to reflect that growth tends to slow more in the early years than it does in later years.
A DCF is all about the idea that a dollar in the future is less valuable than a dollar today, so we need to discount the sum of these future cash flows to arrive at a present value estimate:
10-year free cash flow (FCF) forecast
| 2021 | 2022 | 2023 | 2024 | 2025 | 2026 | 2027 | 2028 | 2029 | 2030 | |
| Levered FCF (₹, Millions) | ₹3.09b | ₹3.53b | ₹3.90b | ₹4.28b | ₹4.65b | ₹5.04b | ₹5.45b | ₹5.87b | ₹6.32b | ₹6.79b |
| Growth Rate Estimate Source | Analyst x1 | Analyst x1 | Est @ 10.63% | Est @ 9.6% | Est @ 8.88% | Est @ 8.37% | Est @ 8.02% | Est @ 7.77% | Est @ 7.59% | Est @ 7.47% |
| Present Value (₹, Millions) Discounted @ 15% | ₹2.7k | ₹2.7k | ₹2.6k | ₹2.5k | ₹2.3k | ₹2.2k | ₹2.1k | ₹1.9k | ₹1.8k | ₹1.7k |
("Est" = FCF growth rate estimated by Simply Wall St)
Present Value of 10-year Cash Flow (PVCF) = ₹23b
The second stage is also known as Terminal Value, this is the business's cash flow after the first stage. For a number of reasons a very conservative growth rate is used that cannot exceed that of a country's GDP growth. In this case we have used the 5-year average of the 10-year government bond yield (7.2%) to estimate future growth. In the same way as with the 10-year 'growth' period, we discount future cash flows to today's value, using a cost of equity of 15%.
Terminal Value (TV)= FCF2030 × (1 + g) ÷ (r – g) = ₹6.8b× (1 + 7.2%) ÷ (15%– 7.2%) = ₹96b
Present Value of Terminal Value (PVTV)= TV / (1 + r)10= ₹96b÷ ( 1 + 15%)10= ₹24b
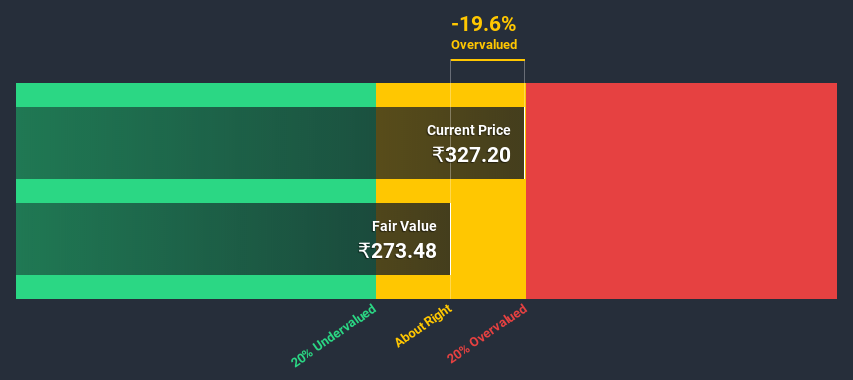
The total value is the sum of cash flows for the next ten years plus the discounted terminal value, which results in the Total Equity Value, which in this case is ₹47b. In the final step we divide the equity value by the number of shares outstanding. Relative to the current share price of ₹327, the company appears around fair value at the time of writing. The assumptions in any calculation have a big impact on the valuation, so it is better to view this as a rough estimate, not precise down to the last cent.
The assumptions
The calculation above is very dependent on two assumptions. The first is the discount rate and the other is the cash flows. You don't have to agree with these inputs, I recommend redoing the calculations yourself and playing with them. The DCF also does not consider the possible cyclicality of an industry, or a company's future capital requirements, so it does not give a full picture of a company's potential performance. Given that we are looking at FDC as potential shareholders, the cost of equity is used as the discount rate, rather than the cost of capital (or weighted average cost of capital, WACC) which accounts for debt. In this calculation we've used 15%, which is based on a levered beta of 0.800. Beta is a measure of a stock's volatility, compared to the market as a whole. We get our beta from the industry average beta of globally comparable companies, with an imposed limit between 0.8 and 2.0, which is a reasonable range for a stable business.
Next Steps:
Although the valuation of a company is important, it ideally won't be the sole piece of analysis you scrutinize for a company. The DCF model is not a perfect stock valuation tool. Preferably you'd apply different cases and assumptions and see how they would impact the company's valuation. For example, changes in the company's cost of equity or the risk free rate can significantly impact the valuation. For FDC, we've put together three relevant factors you should further research:
- Risks: We feel that you should assess the 1 warning sign for FDC we've flagged before making an investment in the company.
- Future Earnings: How does FDC's growth rate compare to its peers and the wider market? Dig deeper into the analyst consensus number for the upcoming years by interacting with our free analyst growth expectation chart.
- Other Solid Businesses: Low debt, high returns on equity and good past performance are fundamental to a strong business. Why not explore our interactive list of stocks with solid business fundamentals to see if there are other companies you may not have considered!
PS. The Simply Wall St app conducts a discounted cash flow valuation for every stock on the NSEI every day. If you want to find the calculation for other stocks just search here.
When trading FDC or any other investment, use the platform considered by many to be the Professional's Gateway to the Worlds Market, Interactive Brokers. You get the lowest-cost* trading on stocks, options, futures, forex, bonds and funds worldwide from a single integrated account. Promoted
New: AI Stock Screener & Alerts
Our new AI Stock Screener scans the market every day to uncover opportunities.
• Dividend Powerhouses (3%+ Yield)
• Undervalued Small Caps with Insider Buying
• High growth Tech and AI Companies
Or build your own from over 50 metrics.
This article by Simply Wall St is general in nature. It does not constitute a recommendation to buy or sell any stock, and does not take account of your objectives, or your financial situation. We aim to bring you long-term focused analysis driven by fundamental data. Note that our analysis may not factor in the latest price-sensitive company announcements or qualitative material. Simply Wall St has no position in any stocks mentioned.
*Interactive Brokers Rated Lowest Cost Broker by StockBrokers.com Annual Online Review 2020
Have feedback on this article? Concerned about the content? Get in touch with us directly. Alternatively, email editorial-team@simplywallst.com.
About NSEI:FDC
FDC
Manufactures and trades in pharmaceutical products in India, the United States, and internationally.
Excellent balance sheet second-rate dividend payer.
Market Insights


Advertisement
Weekly Picks
CE


Ceazar on Eva Live ·
This small cap is building the AI workforce of the future
Fair Value:US$7.4351.3% undervalued
77 followersusers have followed this narrative
0 commentsusers have commented on this narrative
16 likesusers have liked this narrative
TR


tripledub on lululemon athletica ·
Lululemon Got Boring Right About the Time It Got Cheap. That's Usually the Point
Fair Value:US$22042.2% undervalued
26 followersusers have followed this narrative
6 commentsusers have commented on this narrative
28 likesusers have liked this narrative
WO


woodworthfund on Kraft Heinz ·
Kraft Heinz (KHC): Less Drama, More Ketchup
Fair Value:US$3532.0% undervalued
9 followersusers have followed this narrative
0 commentsusers have commented on this narrative
2 likesusers have liked this narrative
CA


Canderous on PetroTal ·
Beyond 2026, Beyond a Double
Fair Value:CA$1.8166.9% undervalued
29 followersusers have followed this narrative
0 commentsusers have commented on this narrative
5 likesusers have liked this narrative
Recently Updated Narratives
DE


DeathSmiIes on New Horizon Aircraft ·
HORIZON AIRCRAFT (HOVR)
Fair Value:US$2084.3% undervalued
6 followersusers have followed this narrative
0 commentsusers have commented on this narrative
0 likesusers have liked this narrative
BE

berkdnd on Yeo Teknoloji Enerji Ve Endustri Anonim Sirketi ·
Yeo Teknoloji Enerji için hedef fiyat analizi
Fair Value:₺152.726.4% undervalued
3 followersusers have followed this narrative
0 commentsusers have commented on this narrative
0 likesusers have liked this narrative
JA


Janpeo on Stellantis ·
IA Analysis
Fair Value:€1140.8% undervalued
3 followersusers have followed this narrative
0 commentsusers have commented on this narrative
0 likesusers have liked this narrative
Popular Narratives
GO

GoldenSands on QuantumScape ·
QuantumScape: A Mispriced Deep‑Tech Inflection Point With Multi‑Billion‑Dollar Optionality
Fair Value:US$8590.4% undervalued
113 followersusers have followed this narrative
2 commentsusers have commented on this narrative
31 likesusers have liked this narrative
AN


AnalystConsensusTarget on NVIDIA ·
NVDA: Expanding AI Demand Will Drive Major Data Center Investments Through 2026
Fair Value:US$268.6119.8% undervalued
1194 followersusers have followed this narrative
7 commentsusers have commented on this narrative
34 likesusers have liked this narrative
TR
tripledub on lululemon athletica ·
Lululemon Got Boring Right About the Time It Got Cheap. That's Usually the Point
Fair Value:US$22042.2% undervalued
26 followersusers have followed this narrative
6 commentsusers have commented on this narrative
28 likesusers have liked this narrative

