
The goal of this article is to teach you how to use price to earnings ratios (P/E ratios). We'll look at Shangri-La Asia Limited's (HKG:69) P/E ratio and reflect on what it tells us about the company's share price. Shangri-La Asia has a price to earnings ratio of 24.15, based on the last twelve months. That means that at current prices, buyers pay HK$24.15 for every HK$1 in trailing yearly profits.
See our latest analysis for Shangri-La Asia
How Do I Calculate Shangri-La Asia's Price To Earnings Ratio?
The formula for price to earnings is:
Price to Earnings Ratio = Share Price (in reporting currency) ÷ Earnings per Share (EPS)
Or for Shangri-La Asia:
P/E of 24.15 = $1.05 (Note: this is the share price in the reporting currency, namely, USD ) ÷ $0.043 (Based on the year to June 2019.)
Is A High Price-to-Earnings Ratio Good?
A higher P/E ratio means that investors are paying a higher price for each HK$1 of company earnings. That is not a good or a bad thing per se, but a high P/E does imply buyers are optimistic about the future.
How Does Shangri-La Asia's P/E Ratio Compare To Its Peers?
One good way to get a quick read on what market participants expect of a company is to look at its P/E ratio. As you can see below, Shangri-La Asia has a higher P/E than the average company (11.4) in the hospitality industry.
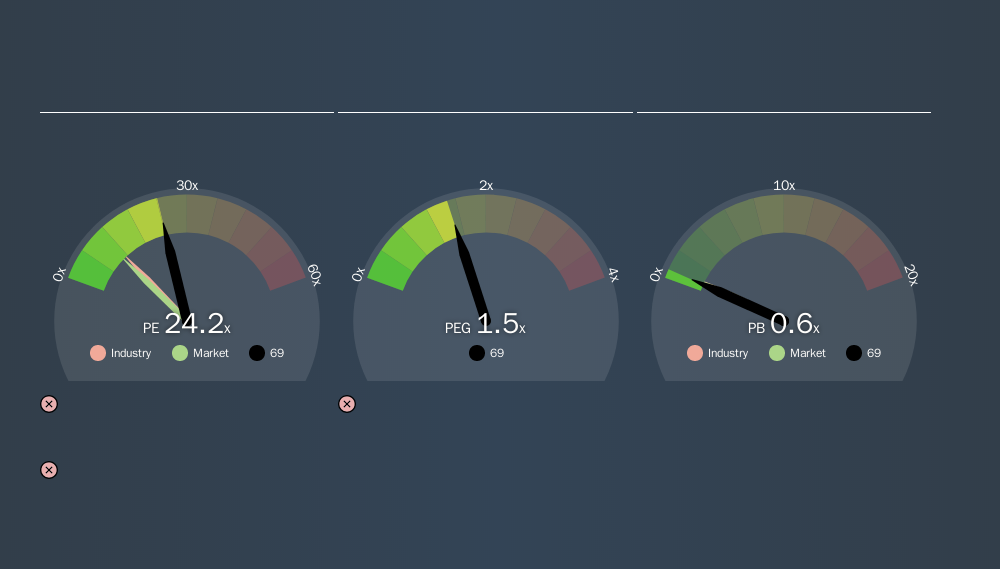
Its relatively high P/E ratio indicates that Shangri-La Asia shareholders think it will perform better than other companies in its industry classification.
How Growth Rates Impact P/E Ratios
P/E ratios primarily reflect market expectations around earnings growth rates. If earnings are growing quickly, then the 'E' in the equation will increase faster than it would otherwise. And in that case, the P/E ratio itself will drop rather quickly. And as that P/E ratio drops, the company will look cheap, unless its share price increases.
Shangri-La Asia shrunk earnings per share by 38% over the last year. But it has grown its earnings per share by 60% per year over the last three years. And EPS is down 12% a year, over the last 5 years. This could justify a pessimistic P/E.
Remember: P/E Ratios Don't Consider The Balance Sheet
It's important to note that the P/E ratio considers the market capitalization, not the enterprise value. So it won't reflect the advantage of cash, or disadvantage of debt. Theoretically, a business can improve its earnings (and produce a lower P/E in the future) by investing in growth. That means taking on debt (or spending its cash).
Spending on growth might be good or bad a few years later, but the point is that the P/E ratio does not account for the option (or lack thereof).
So What Does Shangri-La Asia's Balance Sheet Tell Us?
Shangri-La Asia's net debt is considerable, at 116% of its market cap. If you want to compare its P/E ratio to other companies, you must keep in mind that these debt levels would usually warrant a relatively low P/E.
The Verdict On Shangri-La Asia's P/E Ratio
Shangri-La Asia has a P/E of 24.2. That's higher than the average in its market, which is 10.4. With significant debt and no EPS growth last year, shareholders are betting on an improvement in earnings from the company.
When the market is wrong about a stock, it gives savvy investors an opportunity. If the reality for a company is better than it expects, you can make money by buying and holding for the long term. So this free visualization of the analyst consensus on future earnings could help you make the right decision about whether to buy, sell, or hold.
But note: Shangri-La Asia may not be the best stock to buy. So take a peek at this free list of interesting companies with strong recent earnings growth (and a P/E ratio below 20).
We aim to bring you long-term focused research analysis driven by fundamental data. Note that our analysis may not factor in the latest price-sensitive company announcements or qualitative material.
If you spot an error that warrants correction, please contact the editor at editorial-team@simplywallst.com. This article by Simply Wall St is general in nature. It does not constitute a recommendation to buy or sell any stock, and does not take account of your objectives, or your financial situation. Simply Wall St has no position in the stocks mentioned. Thank you for reading.
About SEHK:69
Shangri-La Asia
An investment holding company, develops, owns/leases, operates, and manages hotels and associated properties worldwide.
Moderate growth potential second-rate dividend payer.
Similar Companies
Market Insights

Weekly Picks

Early mover in a fast growing industry. Likely to experience share price volatility as they scale


A case for CA$31.80 (undiluted), aka 8,616% upside from CA$0.37 (an 86 bagger!).


Moderation and Stabilisation: HOLD: Fair Price based on a 4-year Cycle is $12.08
Recently Updated Narratives

A case for USD $14.81 per share based on book value. Be warned, this is a micro-cap dependent on a single mine.

Occidental Petroleum to Become Fairly Priced at $68.29 According to Future Projections

Agfa-Gevaert is a digital and materials turnaround opportunity, with growth potential in ZIRFON, but carrying legacy risks.
Popular Narratives


MicroVision will explode future revenue by 380.37% with a vision towards success


Crazy Undervalued 42 Baggers Silver Play (Active & Running Mine)


