
Advertisement
- United Kingdom
- /
- Insurance
- /
- AIM:RQIH
Does Randall & Quilter Investment Holdings Ltd (LON:RQIH) Have A Good P/E Ratio?

The goal of this article is to teach you how to use price to earnings ratios (P/E ratios). We'll apply a basic P/E ratio analysis to Randall & Quilter Investment Holdings Ltd's (LON:RQIH), to help you decide if the stock is worth further research. Looking at earnings over the last twelve months, Randall & Quilter Investment Holdings has a P/E ratio of 8.16. That means that at current prices, buyers pay £8.16 for every £1 in trailing yearly profits.
See our latest analysis for Randall & Quilter Investment Holdings
How Do I Calculate A Price To Earnings Ratio?
The formula for price to earnings is:
Price to Earnings Ratio = Share Price ÷ Earnings per Share (EPS)
Or for Randall & Quilter Investment Holdings:
P/E of 8.16 = £1.750 ÷ £0.214 (Based on the year to December 2019.)
(Note: the above calculation results may not be precise due to rounding.)
Is A High Price-to-Earnings Ratio Good?
The higher the P/E ratio, the higher the price tag of a business, relative to its trailing earnings. That isn't necessarily good or bad, but a high P/E implies relatively high expectations of what a company can achieve in the future.
Does Randall & Quilter Investment Holdings Have A Relatively High Or Low P/E For Its Industry?
The P/E ratio essentially measures market expectations of a company. The image below shows that Randall & Quilter Investment Holdings has a lower P/E than the average (11.4) P/E for companies in the insurance industry.
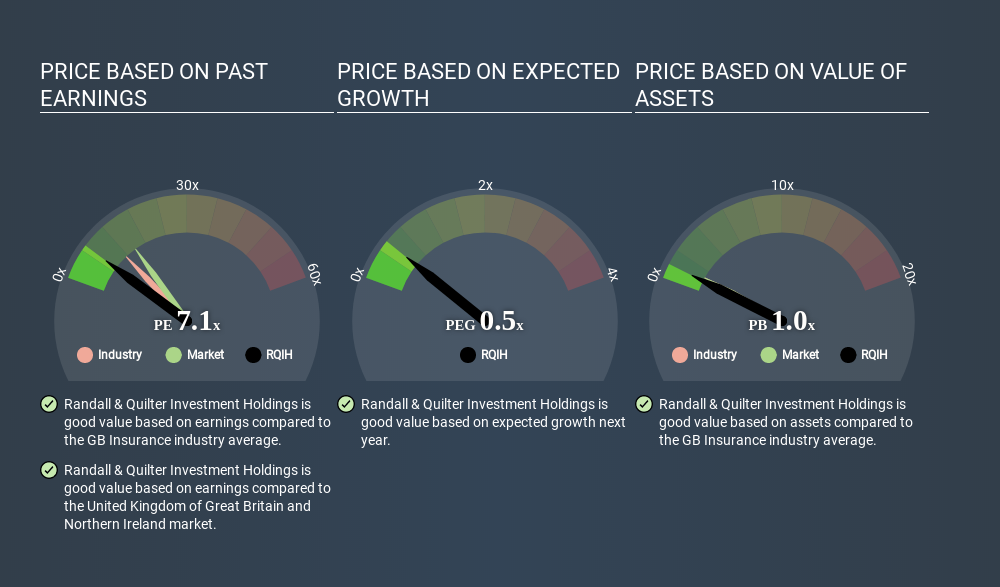
This suggests that market participants think Randall & Quilter Investment Holdings will underperform other companies in its industry. Since the market seems unimpressed with Randall & Quilter Investment Holdings, it's quite possible it could surprise on the upside. You should delve deeper. I like to check if company insiders have been buying or selling.
How Growth Rates Impact P/E Ratios
P/E ratios primarily reflect market expectations around earnings growth rates. Earnings growth means that in the future the 'E' will be higher. Therefore, even if you pay a high multiple of earnings now, that multiple will become lower in the future. And as that P/E ratio drops, the company will look cheap, unless its share price increases.
Randall & Quilter Investment Holdings's earnings made like a rocket, taking off 175% last year. And earnings per share have improved by 29% annually, over the last three years. So we'd absolutely expect it to have a relatively high P/E ratio.
A Limitation: P/E Ratios Ignore Debt and Cash In The Bank
Don't forget that the P/E ratio considers market capitalization. So it won't reflect the advantage of cash, or disadvantage of debt. The exact same company would hypothetically deserve a higher P/E ratio if it had a strong balance sheet, than if it had a weak one with lots of debt, because a cashed up company can spend on growth.
While growth expenditure doesn't always pay off, the point is that it is a good option to have; but one that the P/E ratio ignores.
Randall & Quilter Investment Holdings's Balance Sheet
Randall & Quilter Investment Holdings has net cash of UK£121m. This is fairly high at 32% of its market capitalization. That might mean balance sheet strength is important to the business, but should also help push the P/E a bit higher than it would otherwise be.
The Bottom Line On Randall & Quilter Investment Holdings's P/E Ratio
Randall & Quilter Investment Holdings's P/E is 8.2 which is below average (15.0) in the GB market. The net cash position gives plenty of options to the business, and the recent improvement in EPS is good to see. The below average P/E ratio suggests that market participants don't believe the strong growth will continue.
Investors have an opportunity when market expectations about a stock are wrong. If it is underestimating a company, investors can make money by buying and holding the shares until the market corrects itself. So this free report on the analyst consensus forecasts could help you make a master move on this stock.
You might be able to find a better buy than Randall & Quilter Investment Holdings. If you want a selection of possible winners, check out this free list of interesting companies that trade on a P/E below 20 (but have proven they can grow earnings).
Love or hate this article? Concerned about the content? Get in touch with us directly. Alternatively, email editorial-team@simplywallst.com.
This article by Simply Wall St is general in nature. It does not constitute a recommendation to buy or sell any stock, and does not take account of your objectives, or your financial situation. We aim to bring you long-term focused analysis driven by fundamental data. Note that our analysis may not factor in the latest price-sensitive company announcements or qualitative material. Simply Wall St has no position in any stocks mentioned. Thank you for reading.
About AIM:RQIH
R&Q Insurance Holdings
Operates as a non-life speciality insurance company in the United Kingdom, North America, and Europe.
Mediocre balance sheet low.
Market Insights

Advertisement
Community Narratives
Scaling up in building materials with smart M&A and growing profitability
Fair Value US$2.77|31.0% undervalued
CM
Community Contributor
Hims: The Platform Powering Personalised Healthcare
Fair Value US$114.01|53.1% undervalued
BL
Community Contributor
Undervalued lottery company with strong fundamentals
Fair Value AU$15.00|34.5% undervalued
RO
Community Contributor
Proximus, transferring money from the impatient to the patient investor
Fair Value €16.62|54.5% undervalued
AX
Community Contributor