
Advertisement
Today we'll do a simple run through of a valuation method used to estimate the attractiveness of Tesmec S.p.A. (BIT:TES) as an investment opportunity by taking the expected future cash flows and discounting them to today's value. This is done using the Discounted Cash Flow (DCF) model. Don't get put off by the jargon, the math behind it is actually quite straightforward.
Companies can be valued in a lot of ways, so we would point out that a DCF is not perfect for every situation. If you want to learn more about discounted cash flow, the rationale behind this calculation can be read in detail in the Simply Wall St analysis model.
See our latest analysis for Tesmec
The calculation
We're using the 2-stage growth model, which simply means we take in account two stages of company's growth. In the initial period the company may have a higher growth rate and the second stage is usually assumed to have a stable growth rate. In the first stage we need to estimate the cash flows to the business over the next ten years. Where possible we use analyst estimates, but when these aren't available we extrapolate the previous free cash flow (FCF) from the last estimate or reported value. We assume companies with shrinking free cash flow will slow their rate of shrinkage, and that companies with growing free cash flow will see their growth rate slow, over this period. We do this to reflect that growth tends to slow more in the early years than it does in later years.
A DCF is all about the idea that a dollar in the future is less valuable than a dollar today, and so the sum of these future cash flows is then discounted to today's value:
10-year free cash flow (FCF) forecast
| 2020 | 2021 | 2022 | 2023 | 2024 | 2025 | 2026 | 2027 | 2028 | 2029 | |
| Levered FCF (€, Millions) | €4.8m | €6.5m | €7.8m | €9.0m | €10.0m | €10.9m | €11.7m | €12.4m | €13.0m | €13.6m |
| Growth Rate Estimate Source | Analyst x1 | Analyst x1 | Est @ 20.27% | Est @ 15.07% | Est @ 11.43% | Est @ 8.88% | Est @ 7.1% | Est @ 5.85% | Est @ 4.97% | Est @ 4.36% |
| Present Value (€, Millions) Discounted @ 20.97% | €4.0 | €4.4 | €4.4 | €4.2 | €3.9 | €3.5 | €3.1 | €2.7 | €2.3 | €2.0 |
("Est" = FCF growth rate estimated by Simply Wall St)
Present Value of 10-year Cash Flow (PVCF)= €34.0m
After calculating the present value of future cash flows in the intial 10-year period, we need to calculate the Terminal Value, which accounts for all future cash flows beyond the first stage. For a number of reasons a very conservative growth rate is used that cannot exceed that of a country's GDP growth. In this case we have used the 10-year government bond rate (2.9%) to estimate future growth. In the same way as with the 10-year 'growth' period, we discount future cash flows to today's value, using a cost of equity of 21%.
Terminal Value (TV) = FCF2029 × (1 + g) ÷ (r – g) = €14m × (1 + 2.9%) ÷ (21% – 2.9%) = €77m
Present Value of Terminal Value (PVTV) = TV / (1 + r)10 = €€77m ÷ ( 1 + 21%)10 = €11.52m
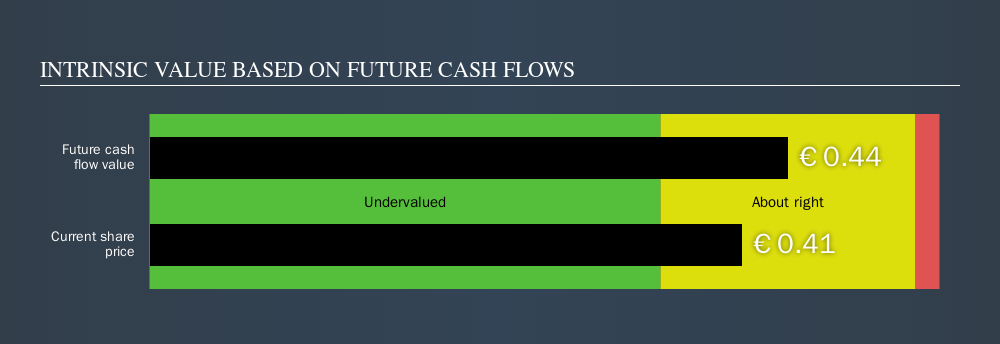
The total value is the sum of cash flows for the next ten years plus the discounted terminal value, which results in the Total Equity Value, which in this case is €45.52m. To get the intrinsic value per share, we divide this by the total number of shares outstanding. This results in an intrinsic value estimate of €0.44. Compared to the current share price of €0.41, the company appears about fair value at a 7.1% discount to where the stock price trades currently. Valuations are imprecise instruments though, rather like a telescope - move a few degrees and end up in a different galaxy. Do keep this in mind.
Important assumptions
Now the most important inputs to a discounted cash flow are the discount rate, and of course, the actual cash flows. If you don't agree with these result, have a go at the calculation yourself and play with the assumptions. The DCF also does not consider the possible cyclicality of an industry, or a company's future capital requirements, so it does not give a full picture of a company's potential performance. Given that we are looking at Tesmec as potential shareholders, the cost of equity is used as the discount rate, rather than the cost of capital (or weighted average cost of capital, WACC) which accounts for debt. In this calculation we've used 21%, which is based on a levered beta of 2. Beta is a measure of a stock's volatility, compared to the market as a whole. We get our beta from the industry average beta of globally comparable companies, with an imposed limit between 0.8 and 2.0, which is a reasonable range for a stable business.
Next Steps:
Valuation is only one side of the coin in terms of building your investment thesis, and it shouldn’t be the only metric you look at when researching a company. The DCF model is not a perfect stock valuation tool. Rather it should be seen as a guide to "what assumptions need to be true for this stock to be under/overvalued?" If a company grows at a different rate, or if its cost of equity or risk free rate changes sharply, the output can look very different. For Tesmec, There are three important aspects you should further research:
- Financial Health: Does TES have a healthy balance sheet? Take a look at our free balance sheet analysis with six simple checks on key factors like leverage and risk.
- Future Earnings: How does TES's growth rate compare to its peers and the wider market? Dig deeper into the analyst consensus number for the upcoming years by interacting with our free analyst growth expectation chart.
- Other High Quality Alternatives: Are there other high quality stocks you could be holding instead of TES? Explore our interactive list of high quality stocks to get an idea of what else is out there you may be missing!
PS. The Simply Wall St app conducts a discounted cash flow valuation for every stock on the BIT every day. If you want to find the calculation for other stocks just search here.
We aim to bring you long-term focused research analysis driven by fundamental data. Note that our analysis may not factor in the latest price-sensitive company announcements or qualitative material.
If you spot an error that warrants correction, please contact the editor at editorial-team@simplywallst.com. This article by Simply Wall St is general in nature. It does not constitute a recommendation to buy or sell any stock, and does not take account of your objectives, or your financial situation. Simply Wall St has no position in the stocks mentioned. Thank you for reading.
M

The Foxhole
Everyone's watching the oil price. The harder problem is the gas that can't take a detour.
118
R
Rob_Curious
What I've learnt in the last six months is that fuel supply disruption is a real portfolio risk, and one of the better hedges is a small allocation to shipping. Though it's insane how much these have run up this year.
f
frank_ub3n0
Spot on. Shipping and logistics is much larger constraint for gas than oil. Sorry to break it to you. No quick fixes for that.
 Mitchell Lawler
Market Insights
What happens to energy stocks as the fix gets built?

Conflict around the Strait of Hormuz has led investors to oil and tankers. The trouble is, the antidote to the chokepoints is already being built, and it may not reward the same energy stocks.
22
About BIT:TES
Tesmec
Designs, manufactures, and sells products, technologies, and integrated solutions for the construction, maintenance, and efficiency of infrastructures related to the transport and distribution of energy, data, and material.
Reasonable growth potential with adequate balance sheet.
Market Insights


Advertisement
Weekly Picks
CE


Ceazar on Sparc AI ·
When GPS fails: this small cap is fixing a $54B drone problem
Fair Value:CA$5.2532.6% undervalued
207 followersusers have followed this narrative
0 commentsusers have commented on this narrative
31 likesusers have liked this narrative
CO


composite32 on Archrock ·
AI Needs Power. Power Needs Gas. Gas Needs Compression: The Archrock Investment Thesis
Fair Value:US$44.8829.7% undervalued
34 followersusers have followed this narrative
2 commentsusers have commented on this narrative
3 likesusers have liked this narrative
JO


John_Eric on Advanced Energy Industries ·
AEIS Is Firing on Every Cylinder. My Problem Is the Safety Factor.
Fair Value:US$567.8653.8% undervalued
21 followersusers have followed this narrative
0 commentsusers have commented on this narrative
7 likesusers have liked this narrative
IS

isidrohg on Lam Research ·
The Memory Shortage Is Lam's Order Book — Whether It Persists Or Resolves
Fair Value:US$423.8532.0% undervalued
25 followersusers have followed this narrative
0 commentsusers have commented on this narrative
7 likesusers have liked this narrative
Recently Updated Narratives
KA

KASHIF_RIAZ_ on Service Long March Tyres ·
SLM: Pakistan's radial-tyre import-substitution play, fairly valued near listing price
Fair Value:PK₨26.514.0% undervalued
1 followerusers have followed this narrative
0 commentsusers have commented on this narrative
0 likesusers have liked this narrative
CO


Constantin_Mar on Platform Group SE KGaA ·
High risk. Massive upside. I’m betting on execution.
Fair Value:€8.6989.0% undervalued
3 followersusers have followed this narrative
3 commentsusers have commented on this narrative
1 likeusers have liked this narrative
RO


RockeTeller on New Found Gold ·
New Found Gold Is No Longer Cheap, Here’s the Real NAV at $2,500 Gold
Fair Value:CA$10.0174.4% undervalued
10 followersusers have followed this narrative
0 commentsusers have commented on this narrative
0 likesusers have liked this narrative
Popular Narratives
AN


AnalystConsensusTarget on NVIDIA ·
NVDA: Expanding AI Demand Will Drive Major Data Center Investments Through 2026
Fair Value:US$302.8326.6% undervalued
1483 followersusers have followed this narrative
8 commentsusers have commented on this narrative
35 likesusers have liked this narrative
AN

AnalystConsensusTarget on Alphabet ·
GOOGL: AI Platform Expansion And Cloud Demand Will Support Durable Performance Amid Competitive Pressures
Fair Value:US$427.8918.3% undervalued
1647 followersusers have followed this narrative
0 commentsusers have commented on this narrative
19 likesusers have liked this narrative
AN

AnalystConsensusTarget on Amazon.com ·
AMZN: Acceleration In Cloud And AI Will Drive Margin Expansion Ahead
Fair Value:US$32722.4% undervalued
1661 followersusers have followed this narrative
1 commentusers have commented on this narrative
16 likesusers have liked this narrative
Trending Discussion


AN
anthony_x0j2w on Platform Group SE KGaA ·
Hello,(I am a shareholder).I spent the summer investigating in whatever I was able to find in the press, the trustee, or legal, and comparing it to FS Benner's declaration/transcripts:press: MM has a tendancy to use facts, modify them and turn them the way they want: 100% of their claims against TPG0 is traçable factually, 80% is flawed and interpreted. Example are numerous: 11M loans banks to be paid seems right, but it has not been an issue at all, it has been paid in full. (and it happens all the time in every business...); the previous HR becoming a financial director in the article herself being attacked by TPG on the legal side; the wrong address of curator (if truly announced by TPG).Trustee: according to my research (which can be incomplete) no communication to the Nordic trustee (hereby, bond holders) has been done on a, indebtedness (late payment) > 1M€, which is their obligation by contract (clause 14.d - https://corporate.the-platform-group.com/bond/) => this is a sign of a huge lie and fraud, or the sign that there is no indebtedness > 1M€ over the whole TPG group.Legal: still awaiting for an answer, probable that I won't get it.VALUATIONYou can spent hours working the fundamentals, if they're flawed...the thesis falls.Anyway, I always substracts the badwill (that I consider non-current - you have it in the CFS) & non-controlling interests from my valuation:Earnings ~22MFCF ~40M€The financial statements are not the issue here, we are more on an cheap option on the sincerity of the accounts that a real valuation. Unfortunately, these are unverifiable elements, hence the low price./!\ Careful:the accounts are consolidated and skip the subsidiaries issues...Careful with the business model: TPG0 is a financial holding that acquire subsidiaries, hold the debt, and has no operations. 100% of the Cash Flow comes from subs' dividends => it is a risk here, more a plumber risk than an operational one, but nevertheless...The auditor is too small, and managed by the same firm than before, with 140K€/year commission => it's too low, nobody external really reviewed what Benner and his team are doing internallycapital increase do not go through the CFS, but through change in equity AND equity in the BSIf the equity stays low too long, the WACC increase will be unbearable (I have a 30% global, with a 118% on equity): diluting is expensive => TPG machine can stay broken for a while.Most of the people I talk with never saw this, while this is ESSENTIAL to Benner's business model.SEVERAL EVENTS THAT COULD CHANGE:AEP is being audited by KPMG: if Benner plays the "we will propose KPMG to our shareholders BEOY", this can increase the trust in him significantly/KPMG (or other) to validate the 2026 IFRS accounts & having a word on HGB's: though still consolidated, at least we'll know...AEP being eventually acquired: while it carries a high integration risk due to its size, they talked about it so many times, that trust goes with it.Without this combination of event, the equity is doomed to stay at this level, IMO.Do not forget to also follow the bond: with TPG's announced safe harbor plan for buyback (25% of daily exchange), it is also interesting to check this illiquid and retail market: https://live.deutsche-boerse.com/bond/no0013256834-the-platform-group-ag-8-875-24-28?mic=XFRA
1
|0