Advertisement
- United States
- /
- IT
- /
- NasdaqGS:PRFT
Calculating The Fair Value Of Perficient, Inc. (NASDAQ:PRFT)
In this article we are going to estimate the intrinsic value of Perficient, Inc. (NASDAQ:PRFT) by estimating the company's future cash flows and discounting them to their present value. We will take advantage of the Discounted Cash Flow (DCF) model for this purpose. Believe it or not, it's not too difficult to follow, as you'll see from our example!
We generally believe that a company's value is the present value of all of the cash it will generate in the future. However, a DCF is just one valuation metric among many, and it is not without flaws. If you still have some burning questions about this type of valuation, take a look at the Simply Wall St analysis model.
Check out our latest analysis for Perficient
The model
We use what is known as a 2-stage model, which simply means we have two different periods of growth rates for the company's cash flows. Generally the first stage is higher growth, and the second stage is a lower growth phase. In the first stage we need to estimate the cash flows to the business over the next ten years. Where possible we use analyst estimates, but when these aren't available we extrapolate the previous free cash flow (FCF) from the last estimate or reported value. We assume companies with shrinking free cash flow will slow their rate of shrinkage, and that companies with growing free cash flow will see their growth rate slow, over this period. We do this to reflect that growth tends to slow more in the early years than it does in later years.
A DCF is all about the idea that a dollar in the future is less valuable than a dollar today, and so the sum of these future cash flows is then discounted to today's value:
10-year free cash flow (FCF) forecast
| 2021 | 2022 | 2023 | 2024 | 2025 | 2026 | 2027 | 2028 | 2029 | 2030 | |
| Levered FCF ($, Millions) | US$84.6m | US$91.9m | US$98.1m | US$103.4m | US$107.9m | US$112.0m | US$115.7m | US$119.1m | US$122.4m | US$125.6m |
| Growth Rate Estimate Source | Analyst x1 | Est @ 8.65% | Est @ 6.72% | Est @ 5.37% | Est @ 4.42% | Est @ 3.76% | Est @ 3.3% | Est @ 2.98% | Est @ 2.75% | Est @ 2.59% |
| Present Value ($, Millions) Discounted @ 8.8% | US$77.7 | US$77.6 | US$76.1 | US$73.7 | US$70.7 | US$67.5 | US$64.0 | US$60.6 | US$57.2 | US$54.0 |
("Est" = FCF growth rate estimated by Simply Wall St)
Present Value of 10-year Cash Flow (PVCF) = US$679m
The second stage is also known as Terminal Value, this is the business's cash flow after the first stage. The Gordon Growth formula is used to calculate Terminal Value at a future annual growth rate equal to the 5-year average of the 10-year government bond yield of 2.2%. We discount the terminal cash flows to today's value at a cost of equity of 8.8%.
Terminal Value (TV)= FCF2030 × (1 + g) ÷ (r – g) = US$126m× (1 + 2.2%) ÷ (8.8%– 2.2%) = US$1.9b
Present Value of Terminal Value (PVTV)= TV / (1 + r)10= US$1.9b÷ ( 1 + 8.8%)10= US$836m
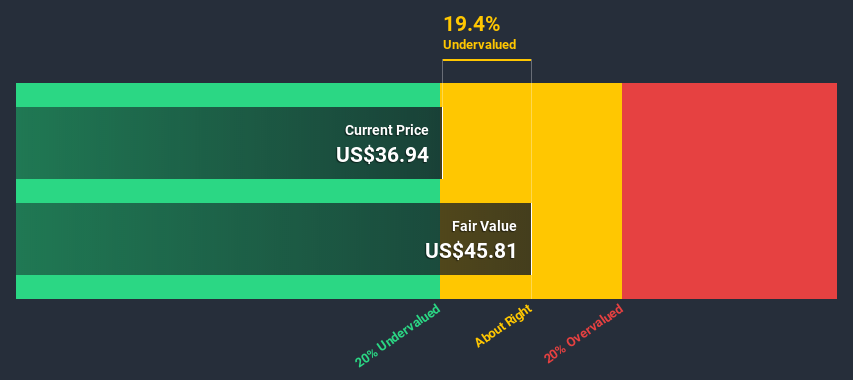
The total value, or equity value, is then the sum of the present value of the future cash flows, which in this case is US$1.5b. In the final step we divide the equity value by the number of shares outstanding. Compared to the current share price of US$36.9, the company appears about fair value at a 19% discount to where the stock price trades currently. Valuations are imprecise instruments though, rather like a telescope - move a few degrees and end up in a different galaxy. Do keep this in mind.
Important assumptions
The calculation above is very dependent on two assumptions. The first is the discount rate and the other is the cash flows. Part of investing is coming up with your own evaluation of a company's future performance, so try the calculation yourself and check your own assumptions. The DCF also does not consider the possible cyclicality of an industry, or a company's future capital requirements, so it does not give a full picture of a company's potential performance. Given that we are looking at Perficient as potential shareholders, the cost of equity is used as the discount rate, rather than the cost of capital (or weighted average cost of capital, WACC) which accounts for debt. In this calculation we've used 8.8%, which is based on a levered beta of 1.097. Beta is a measure of a stock's volatility, compared to the market as a whole. We get our beta from the industry average beta of globally comparable companies, with an imposed limit between 0.8 and 2.0, which is a reasonable range for a stable business.
Looking Ahead:
Valuation is only one side of the coin in terms of building your investment thesis, and it is only one of many factors that you need to assess for a company. DCF models are not the be-all and end-all of investment valuation. Rather it should be seen as a guide to "what assumptions need to be true for this stock to be under/overvalued?" For example, changes in the company's cost of equity or the risk free rate can significantly impact the valuation. For Perficient, there are three relevant items you should further examine:
- Financial Health: Does PRFT have a healthy balance sheet? Take a look at our free balance sheet analysis with six simple checks on key factors like leverage and risk.
- Future Earnings: How does PRFT's growth rate compare to its peers and the wider market? Dig deeper into the analyst consensus number for the upcoming years by interacting with our free analyst growth expectation chart.
- Other High Quality Alternatives: Do you like a good all-rounder? Explore our interactive list of high quality stocks to get an idea of what else is out there you may be missing!
PS. The Simply Wall St app conducts a discounted cash flow valuation for every stock on the NASDAQGS every day. If you want to find the calculation for other stocks just search here.
When trading Perficient or any other investment, use the platform considered by many to be the Professional's Gateway to the Worlds Market, Interactive Brokers. You get the lowest-cost* trading on stocks, options, futures, forex, bonds and funds worldwide from a single integrated account. Promoted
New: Manage All Your Stock Portfolios in One Place
We've created the ultimate portfolio companion for stock investors, and it's free.
• Connect an unlimited number of Portfolios and see your total in one currency
• Be alerted to new Warning Signs or Risks via email or mobile
• Track the Fair Value of your stocks
This article by Simply Wall St is general in nature. It does not constitute a recommendation to buy or sell any stock, and does not take account of your objectives, or your financial situation. We aim to bring you long-term focused analysis driven by fundamental data. Note that our analysis may not factor in the latest price-sensitive company announcements or qualitative material. Simply Wall St has no position in any stocks mentioned.
*Interactive Brokers Rated Lowest Cost Broker by StockBrokers.com Annual Online Review 2020
Have feedback on this article? Concerned about the content? Get in touch with us directly. Alternatively, email editorial-team@simplywallst.com.
About NasdaqGS:PRFT
Perficient
Provides digital consultancy services and solutions in the United States and internationally.
Mediocre balance sheet and slightly overvalued.
Similar Companies
Market Insights


Advertisement
Weekly Picks
CE


Ceazar on Sparc AI ·
When GPS fails: this small cap is fixing a $54B drone problem
Fair Value:CA$5.2552.0% undervalued
120 followersusers have followed this narrative
0 commentsusers have commented on this narrative
25 likesusers have liked this narrative
BL


BlackGoat on IREN ·
IREN's Bold Moves in Sustainable Bitcoin Mining & AI Data Centers
Fair Value:US$71.4848.5% undervalued
222 followersusers have followed this narrative
9 commentsusers have commented on this narrative
33 likesusers have liked this narrative
HE


HedgeY on Arm Holdings ·
The Architecture Layer of AI Computing - But Priced Like the Future Already Arrived?
Fair Value:US$43044.3% undervalued
23 followersusers have followed this narrative
1 commentusers have commented on this narrative
6 likesusers have liked this narrative
HI


Hidden_Rock_Capital on Fiserv ·
Temporary "perfect storm" leads to opportunity to buy financial services leader for less than 5x long-term earnings
Fair Value:US$119.9955.0% undervalued
32 followersusers have followed this narrative
1 commentusers have commented on this narrative
10 likesusers have liked this narrative
Recently Updated Narratives
AR

ariz_scribe on Marti Technologies ·
$MRT at Roth - Pick of the Panel
Fair Value:US$1.965.6% undervalued
7 followersusers have followed this narrative
0 commentsusers have commented on this narrative
0 likesusers have liked this narrative
TR


TripleS on Vistance Networks ·
VISN trades at $11.83 with roughly $1.88 billion of cash and zero debt after closing the sale of its Ruckus division to Belden on July 1
Fair Value:US$1626.6% undervalued
1 followerusers have followed this narrative
0 commentsusers have commented on this narrative
0 likesusers have liked this narrative
JO


John_Eric on Vertiv Holdings Co ·
Everyone's Favorite Stock Just Fell 17% in a Day. It Still Isn't Cheap.
Fair Value:US$21313.4% overvalued
2 followersusers have followed this narrative
0 commentsusers have commented on this narrative
0 likesusers have liked this narrative
Popular Narratives
OS


oscargarcia on NVIDIA ·
The company that went from selling GPUs to gamers to becoming the AI arms dealer of the 21st century.
Fair Value:US$28028.3% undervalued
221 followersusers have followed this narrative
9 commentsusers have commented on this narrative
15 likesusers have liked this narrative
CU

CubanEros on Microsoft ·
A wonderful business at reasonable price.
Fair Value:US$419.9110.7% overvalued
99 followersusers have followed this narrative
0 commentsusers have commented on this narrative
7 likesusers have liked this narrative
TR


tripledub on Alphabet ·
Warren Buffett Just Bet $10 Billion on Google. The Catch? You May Already Be Too Late.
Fair Value:US$23054.8% overvalued
116 followersusers have followed this narrative
1 commentusers have commented on this narrative
18 likesusers have liked this narrative
Trending Discussion
GR
greg_xasak on Fiserv ·
As someone who has dealt directly with them as a CTO for a credit union, I have 8 years of horror stories about doing business with them. If there was any other competitor than could deliver 80% of Fiserv services, there would be a mad rush to migrate to them. They should thank their lucky stars they are a near monopoly. this industry is so ripe for a well funded competitor. Their integration of technology is awful, their ability to fix their own implementation screwups is sadly tragic. Sometimes they just silently kill support tickets without resolution and you never find out until you do a follow up inquiry. Why, because sometimes no one you are dealing with knows how to fix it and knows no one to ask for help. They can not meet their own implementation deadlines and sometimes there is no one on a technical team dealing with you that has any banking or credit union experience. The is an industry insider phrase when you meet other Fiserv customers called being "Fiserved". It means telling others of your worst stories of dealing with them. Ask around, all CTO's have some doozies.
1
|0

