- Canada
- /
- Metals and Mining
- /
- TSXV:MJS
Base Carbon And 2 More Promising Penny Stocks On TSX

Reviewed by Simply Wall St
As Canadian investors navigate a landscape marked by potential changes in U.S. tax policies and rising bond yields, the market's dynamics continue to evolve. Within this context, penny stocks—though often associated with earlier trading days—remain an intriguing investment area for those seeking opportunities beyond established giants. By focusing on companies with strong financial foundations, investors can uncover promising prospects among these smaller or newer enterprises, such as Base Carbon and others on the TSX.
Top 10 Penny Stocks In Canada
| Name | Share Price | Market Cap | Rewards & Risks |
| Westbridge Renewable Energy (TSXV:WEB) | CA$0.75 | CA$75.86M | ✅ 3 ⚠️ 3 View Analysis > |
| NTG Clarity Networks (TSXV:NCI) | CA$2.70 | CA$114.25M | ✅ 4 ⚠️ 2 View Analysis > |
| Intermap Technologies (TSX:IMP) | CA$2.36 | CA$139.72M | ✅ 3 ⚠️ 1 View Analysis > |
| Orezone Gold (TSX:ORE) | CA$1.20 | CA$636.86M | ✅ 4 ⚠️ 2 View Analysis > |
| McChip Resources (TSXV:MCS) | CA$0.77 | CA$4.4M | ✅ 2 ⚠️ 5 View Analysis > |
| Hemisphere Energy (TSXV:HME) | CA$1.74 | CA$168.16M | ✅ 3 ⚠️ 1 View Analysis > |
| PetroTal (TSX:TAL) | CA$0.60 | CA$548.99M | ✅ 3 ⚠️ 3 View Analysis > |
| Pulse Seismic (TSX:PSD) | CA$2.61 | CA$132.47M | ✅ 1 ⚠️ 2 View Analysis > |
| Findev (TSXV:FDI) | CA$0.44 | CA$12.6M | ✅ 2 ⚠️ 3 View Analysis > |
| BluMetric Environmental (TSXV:BLM) | CA$1.43 | CA$52.9M | ✅ 2 ⚠️ 4 View Analysis > |
Click here to see the full list of 905 stocks from our TSX Penny Stocks screener.
Let's take a closer look at a couple of our picks from the screened companies.
Base Carbon (NEOE:BCBN)
Simply Wall St Financial Health Rating: ★★★★★★
Overview: Base Carbon Inc., along with its subsidiaries, offers capital, development expertise, and management operating resources, with a market cap of CA$82.75 million.
Operations: There are no reported revenue segments for Base Carbon Inc. at this time.
Market Cap: CA$82.75M
Base Carbon Inc., with a market cap of CA$82.75 million, is currently pre-revenue and unprofitable, which is common in the penny stock realm. The company has no debt, alleviating interest coverage concerns, and its short-term assets significantly exceed liabilities. Despite this financial cushion, Base Carbon's earnings have declined by 14.9% annually over the past five years. Recent earnings showed a net income of US$0.52 million for Q1 2025; however, auditors have expressed doubts about its ability to continue as a going concern due to substantial losses in 2024 and ongoing volatility in performance metrics.
- Click to explore a detailed breakdown of our findings in Base Carbon's financial health report.
- Learn about Base Carbon's historical performance here.
Trilogy Metals (TSX:TMQ)
Simply Wall St Financial Health Rating: ★★★★★★
Overview: Trilogy Metals Inc. focuses on the exploration and development of mineral properties in the United States, with a market cap of CA$280.81 million.
Operations: Trilogy Metals Inc. does not report any revenue segments as it is focused on the exploration and development of mineral properties in the United States.
Market Cap: CA$280.81M
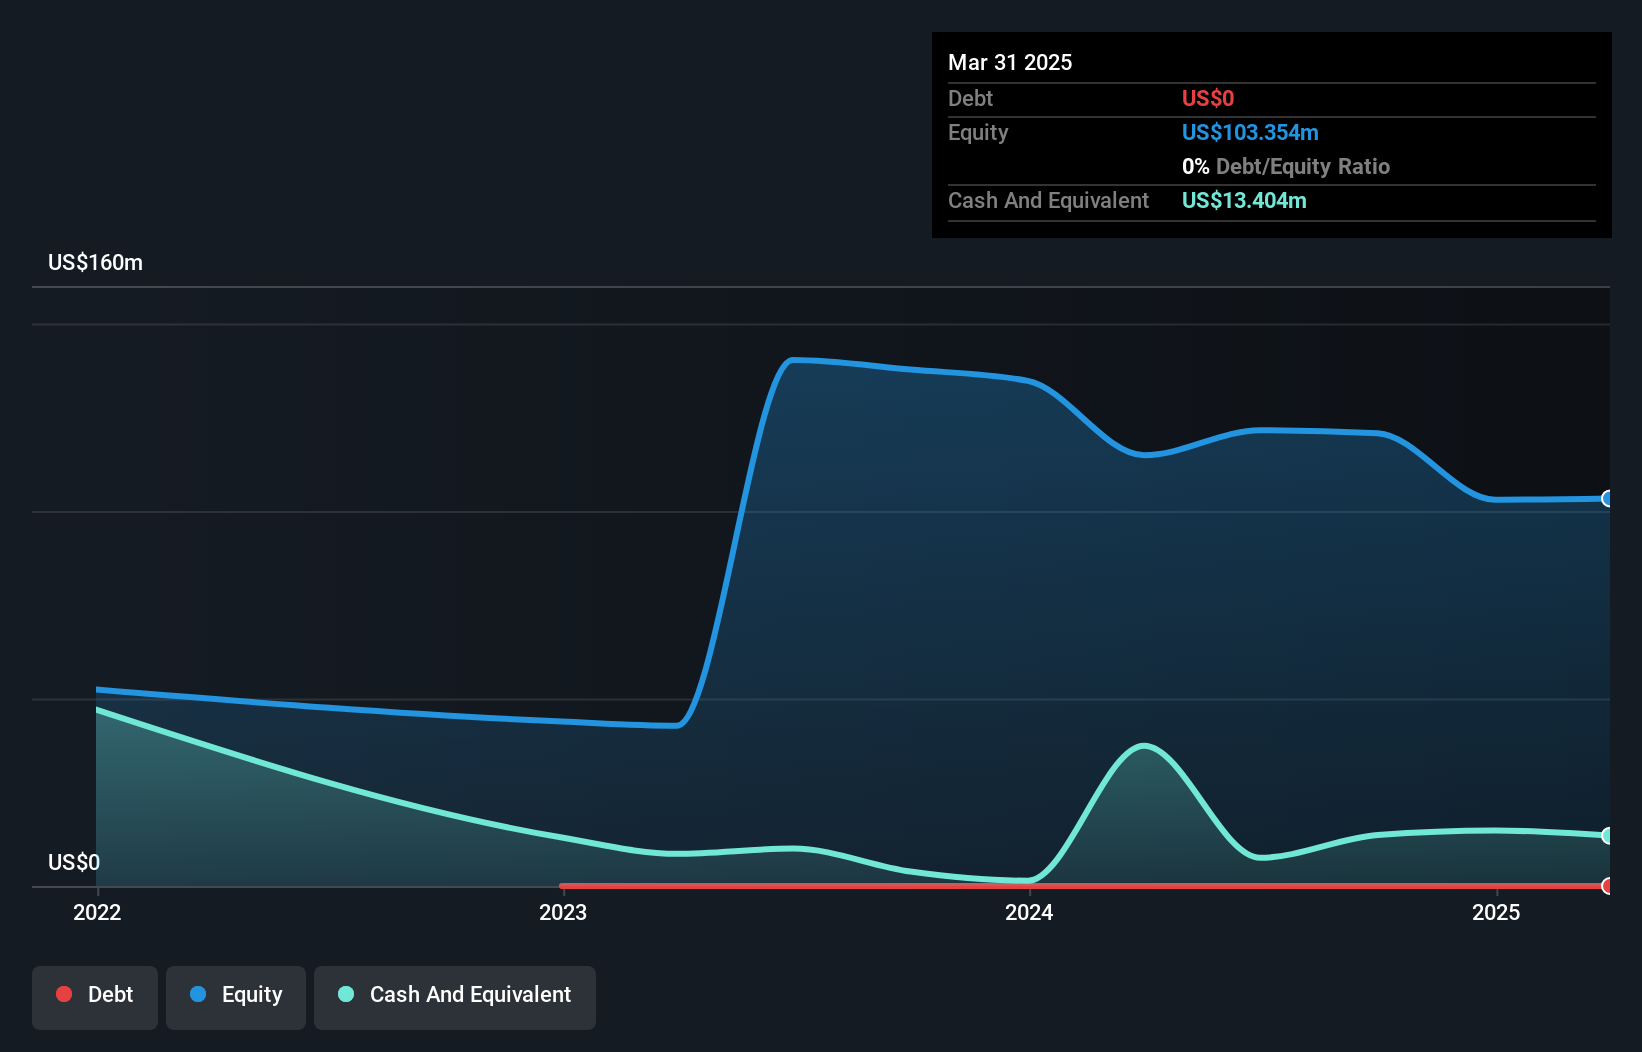
Trilogy Metals Inc., with a market cap of CA$280.81 million, is pre-revenue, typical for exploratory mining firms in the penny stock sector. The company remains debt-free, enhancing financial flexibility, and boasts short-term assets of US$25.3 million that comfortably cover both short and long-term liabilities. Despite this stability, Trilogy Metals has experienced a significant earnings decline of 66.3% annually over the past five years and reported a net loss of US$3.62 million for Q1 2025. Its share price has been highly volatile recently, although volatility has decreased compared to last year.
- Jump into the full analysis health report here for a deeper understanding of Trilogy Metals.
- Gain insights into Trilogy Metals' historical outcomes by reviewing our past performance report.
Majestic Gold (TSXV:MJS)
Simply Wall St Financial Health Rating: ★★★★★★
Overview: Majestic Gold Corp. is a mining company engaged in the exploration, development, and operation of mining properties in China with a market cap of CA$140.76 million.
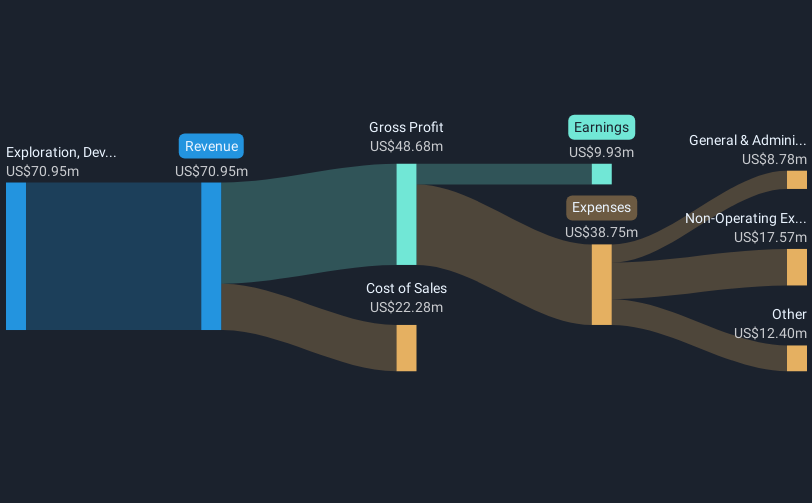
Operations: The company generates revenue of $70.95 million from its activities in exploration, development, and operation of mining properties.
Market Cap: CA$140.76M
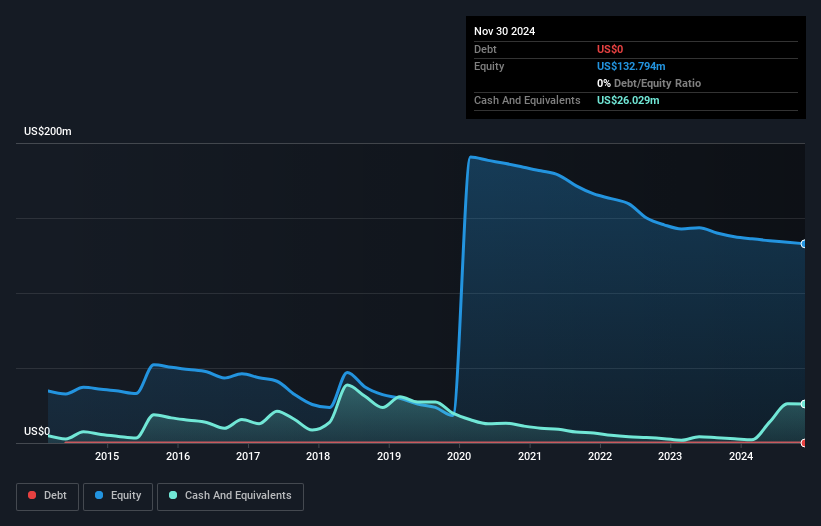
Majestic Gold Corp., with a market cap of CA$140.76 million, operates without debt, enhancing its financial stability. It reported revenues of US$70.95 million for 2024, up from US$55.03 million the previous year, and net income increased to US$9.93 million from US$7.56 million in 2023, reflecting robust earnings growth despite not outperforming the broader industry. The company's short-term assets significantly exceed both short and long-term liabilities, indicating strong liquidity management. Although its share price has been volatile recently, Majestic Gold's earnings quality remains high with no shareholder dilution over the past year and stable profit margins.
- Click here to discover the nuances of Majestic Gold with our detailed analytical financial health report.
- Gain insights into Majestic Gold's past trends and performance with our report on the company's historical track record.
Turning Ideas Into Actions
- Unlock more gems! Our TSX Penny Stocks screener has unearthed 902 more companies for you to explore.Click here to unveil our expertly curated list of 905 TSX Penny Stocks.
- Want To Explore Some Alternatives? These 16 companies survived and thrived after COVID and have the right ingredients to survive Trump's tariffs. Discover why before your portfolio feels the trade war pinch.
This article by Simply Wall St is general in nature. We provide commentary based on historical data and analyst forecasts only using an unbiased methodology and our articles are not intended to be financial advice. It does not constitute a recommendation to buy or sell any stock, and does not take account of your objectives, or your financial situation. We aim to bring you long-term focused analysis driven by fundamental data. Note that our analysis may not factor in the latest price-sensitive company announcements or qualitative material. Simply Wall St has no position in any stocks mentioned.
The New Payments ETF Is Live on NASDAQ:
Money is moving to real-time rails, and a newly listed ETF now gives investors direct exposure. Fast settlement. Institutional custody. Simple access.
Explore how this launch could reshape portfolios
Sponsored ContentNew: Manage All Your Stock Portfolios in One Place
We've created the ultimate portfolio companion for stock investors, and it's free.
• Connect an unlimited number of Portfolios and see your total in one currency
• Be alerted to new Warning Signs or Risks via email or mobile
• Track the Fair Value of your stocks
Have feedback on this article? Concerned about the content? Get in touch with us directly. Alternatively, email editorial-team@simplywallst.com
About TSXV:MJS
Majestic Gold
A mining company, focuses on exploration, development, and operation of mining properties in China.
Excellent balance sheet and good value.
Market Insights

Weekly Picks

Early mover in a fast growing industry. Likely to experience share price volatility as they scale


A case for CA$31.80 (undiluted), aka 8,616% upside from CA$0.37 (an 86 bagger!).


Moderation and Stabilisation: HOLD: Fair Price based on a 4-year Cycle is $12.08
Recently Updated Narratives

Airbnb Stock: Platform Growth in a World of Saturation and Scrutiny

Adobe Stock: AI-Fueled ARR Growth Pushes Guidance Higher, But Cost Pressures Loom

Thomson Reuters Stock: When Legal Intelligence Becomes Mission-Critical Infrastructure
Popular Narratives


Crazy Undervalued 42 Baggers Silver Play (Active & Running Mine)


NVDA: Expanding AI Demand Will Drive Major Data Center Investments Through 2026

The AI Infrastructure Giant Grows Into Its Valuation
Trending Discussion


