Advertisement
- Australia
- /
- Oil and Gas
- /
- ASX:HZN
ASX Penny Stocks Spotlight Australian Strategic Materials And 2 More Hidden Gems

Simply Wall St
Reviewed by Simply Wall St
As the Australian market experiences a gradual downward trend, largely influenced by profit-taking and international tensions, investors are seeking opportunities that can withstand volatility. Penny stocks, though often considered niche investments, still hold potential for growth particularly in smaller or newer companies. When these stocks are backed by solid financial health and fundamentals, they can present underappreciated opportunities for returns without excessive risk.
Top 10 Penny Stocks In Australia
| Name | Share Price | Market Cap | Rewards & Risks |
| EZZ Life Science Holdings (ASX:EZZ) | A$1.50 | A$70.76M | ✅ 4 ⚠️ 2 View Analysis > |
| GTN (ASX:GTN) | A$0.65 | A$124.05M | ✅ 3 ⚠️ 2 View Analysis > |
| IVE Group (ASX:IGL) | A$2.57 | A$396.25M | ✅ 4 ⚠️ 2 View Analysis > |
| Southern Cross Electrical Engineering (ASX:SXE) | A$1.67 | A$441.56M | ✅ 5 ⚠️ 1 View Analysis > |
| Tasmea (ASX:TEA) | A$3.08 | A$725.72M | ✅ 4 ⚠️ 2 View Analysis > |
| Regal Partners (ASX:RPL) | A$2.25 | A$756.37M | ✅ 4 ⚠️ 3 View Analysis > |
| Accent Group (ASX:AX1) | A$1.845 | A$1.11B | ✅ 4 ⚠️ 2 View Analysis > |
| Lindsay Australia (ASX:LAU) | A$0.71 | A$225.19M | ✅ 4 ⚠️ 2 View Analysis > |
| Bisalloy Steel Group (ASX:BIS) | A$3.37 | A$159.91M | ✅ 3 ⚠️ 1 View Analysis > |
| CTI Logistics (ASX:CLX) | A$1.815 | A$146.19M | ✅ 4 ⚠️ 2 View Analysis > |
Click here to see the full list of 1,001 stocks from our ASX Penny Stocks screener.
Let's review some notable picks from our screened stocks.
Australian Strategic Materials (ASX:ASM)
Simply Wall St Financial Health Rating: ★★★★☆☆
Overview: Australian Strategic Materials Ltd is an integrated producer of critical metals for advanced and clean technologies in Australia, with a market cap of A$116.96 million.
Operations: The company's revenue is primarily derived from its operations in Korea, generating A$0.91 million, and the Dubbo Project, contributing A$1.12 million.
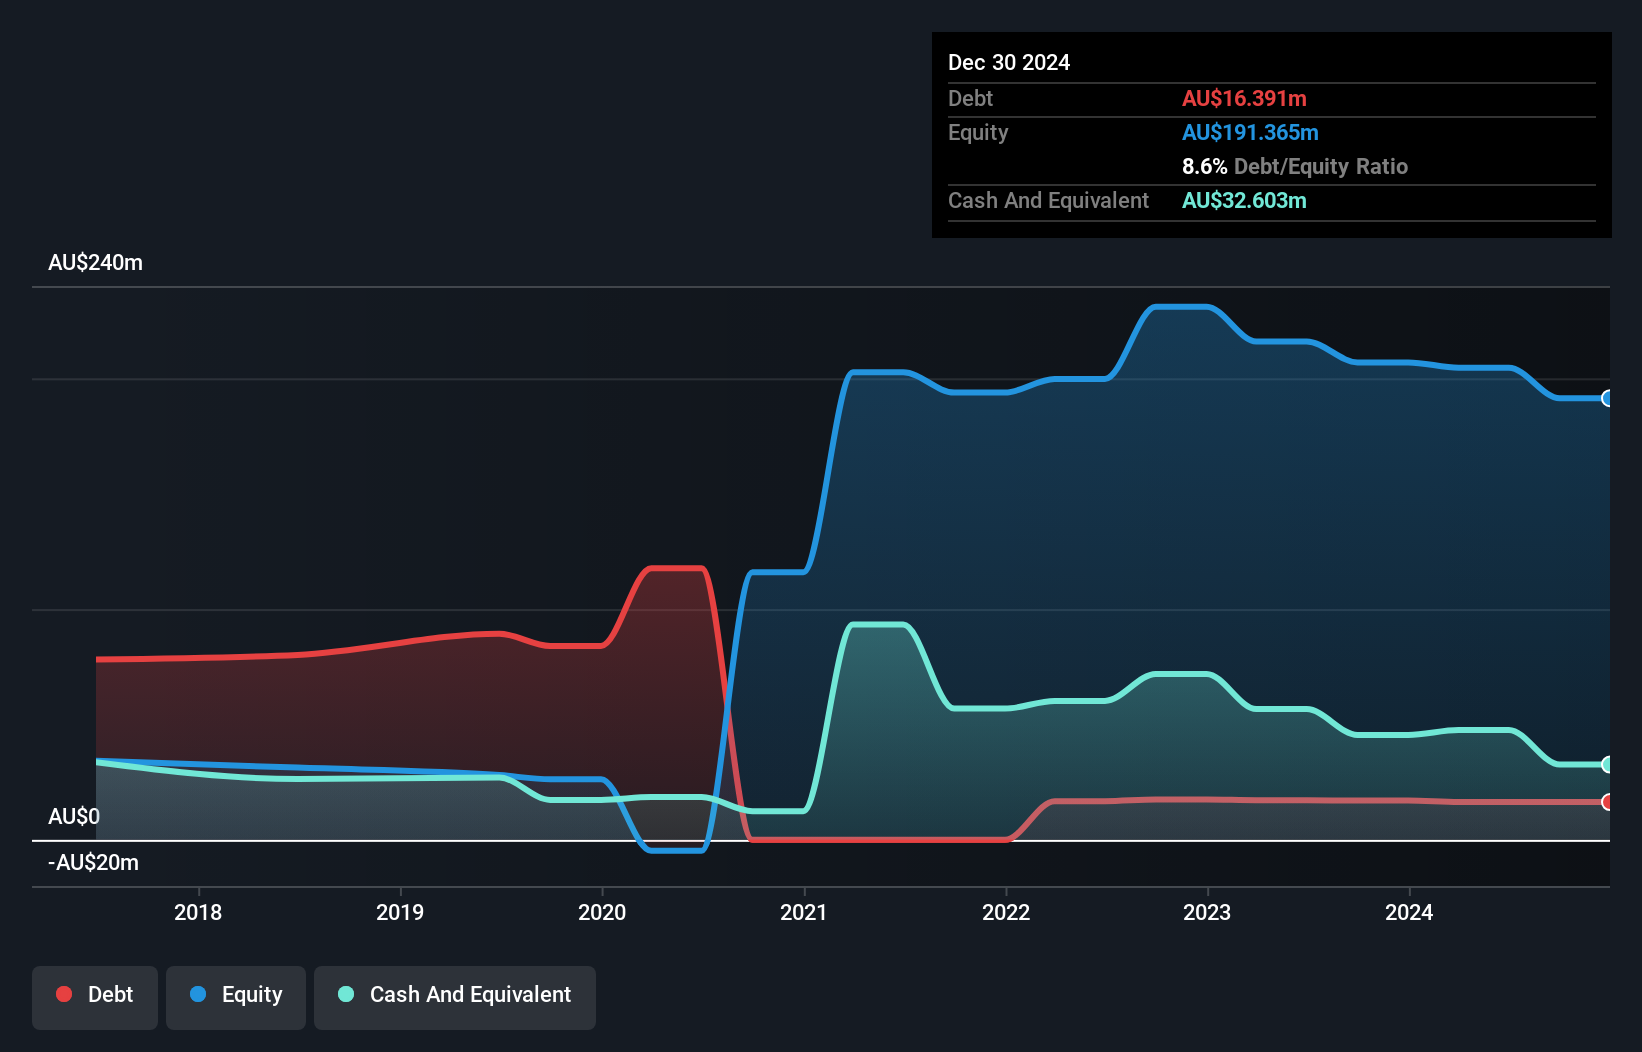
Market Cap: A$116.96M
Australian Strategic Materials Ltd is pre-revenue, with limited sales of A$1.13 million reported for the half year ending December 2024, and a net loss of A$13.96 million. Despite its unprofitability, ASM has reduced its debt to equity ratio significantly over five years from 319.6% to 8.6%, indicating improved financial management. The company has more cash than total debt and short-term assets exceeding both short- and long-term liabilities, suggesting a stable financial position despite high volatility in share price and less than one year of cash runway based on current free cash flow trends.
- Click to explore a detailed breakdown of our findings in Australian Strategic Materials' financial health report.
- Review our historical performance report to gain insights into Australian Strategic Materials' track record.
Horizon Oil (ASX:HZN)
Simply Wall St Financial Health Rating: ★★★★★☆
Overview: Horizon Oil Limited, with a market cap of A$292.55 million, is involved in the exploration, development, and production of oil and gas properties across China, New Zealand, and Australia.
Operations: The company's revenue segments include $60.53 million from exploration and development activities in China and $34.26 million from similar operations in New Zealand.
Market Cap: A$292.55M
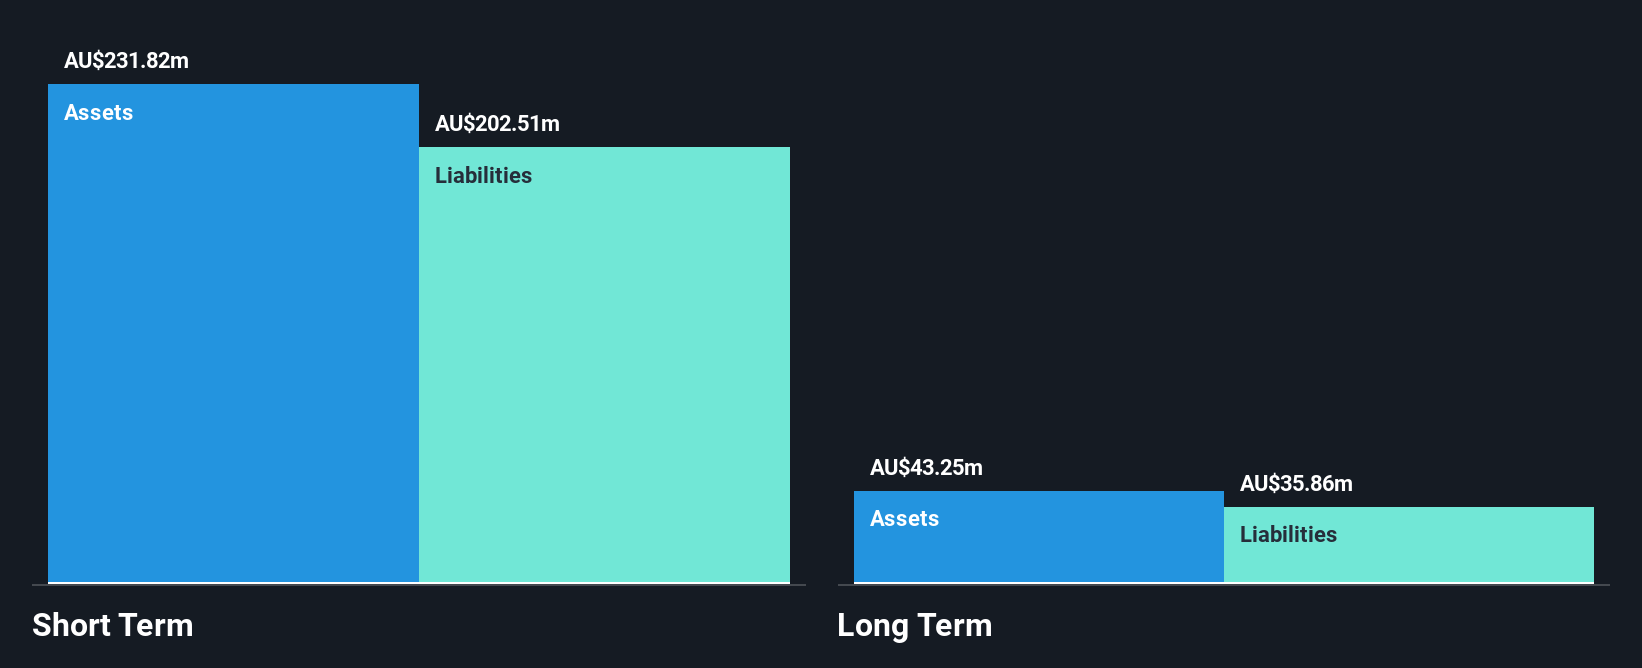
Horizon Oil Limited, with a market cap of A$292.55 million, has demonstrated financial resilience despite recent challenges. The company maintains more cash than its total debt, and its interest payments are well-covered by EBIT at 60.8 times coverage. However, Horizon's dividend yield of 15.3% is not supported by earnings or free cash flow, raising sustainability concerns. Profit margins have decreased to 14.1% from last year's 30.3%, and the company experienced negative earnings growth over the past year (-67%). Recent board changes include appointing Catherine Costello as an independent non-executive director to strengthen governance and strategic oversight.
- Click here and access our complete financial health analysis report to understand the dynamics of Horizon Oil.
- Explore historical data to track Horizon Oil's performance over time in our past results report.
SHAPE Australia (ASX:SHA)
Simply Wall St Financial Health Rating: ★★★★★★
Overview: SHAPE Australia Corporation Limited operates in the construction, fitout, and refurbishment of commercial properties across Australia with a market cap of A$287.93 million.
Operations: The company's revenue is primarily derived from its heavy construction segment, which generated A$902.63 million.
Market Cap: A$287.93M
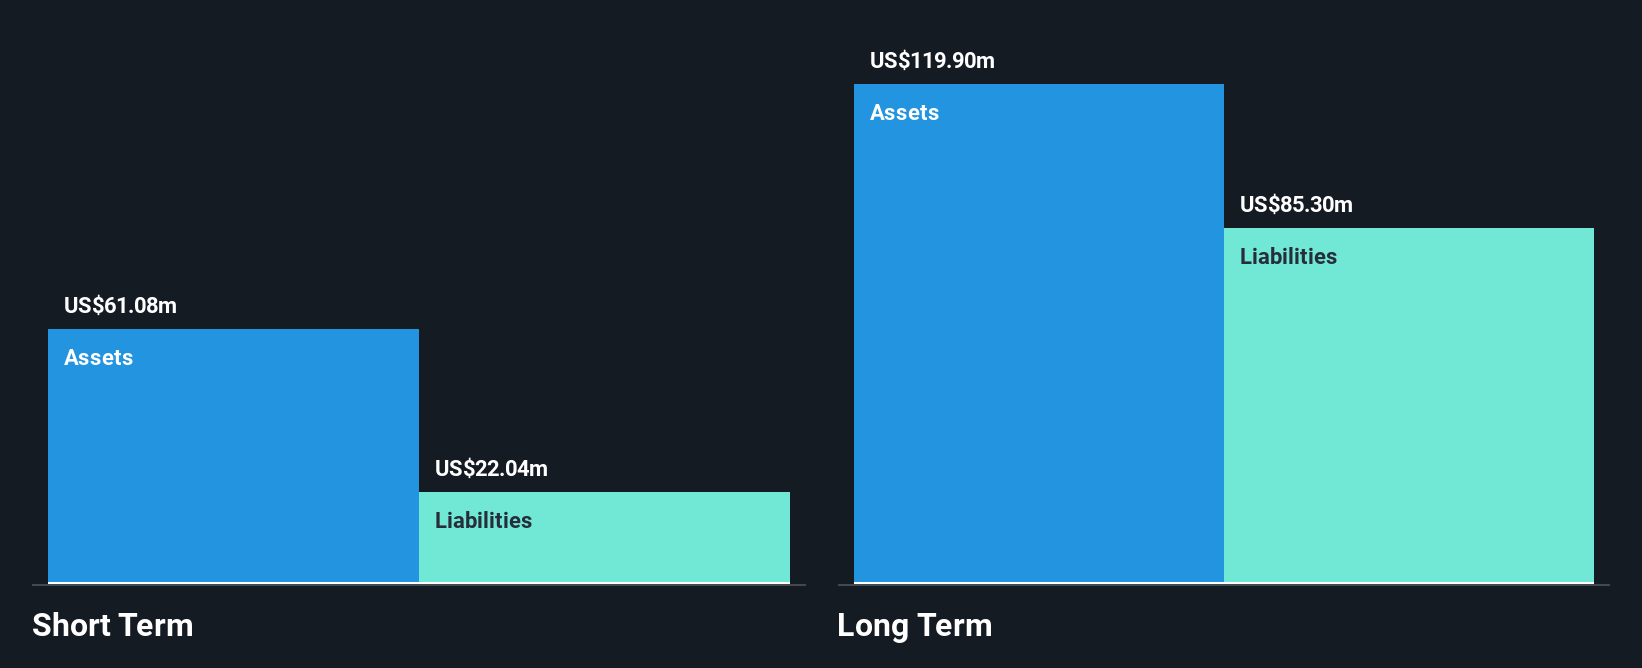
SHAPE Australia Corporation Limited, with a market cap of A$287.93 million, has shown robust financial performance in the construction sector. Despite an unstable dividend track record, its earnings have grown significantly by 34.9% over the past year, surpassing both industry averages and its 5-year growth rate of 9.3% per annum. The company is debt-free and efficiently manages liabilities with short-term assets of A$209.5 million exceeding both short-term and long-term obligations. SHAPE's Return on Equity stands at an impressive 54.2%, indicating high-quality earnings and effective use of equity capital, although management tenure data remains insufficient for assessment.
- Jump into the full analysis health report here for a deeper understanding of SHAPE Australia.
- Explore SHAPE Australia's analyst forecasts in our growth report.
Next Steps
- Click here to access our complete index of 1,001 ASX Penny Stocks.
- Ready To Venture Into Other Investment Styles? Outshine the giants: these 25 early-stage AI stocks could fund your retirement.
This article by Simply Wall St is general in nature. We provide commentary based on historical data and analyst forecasts only using an unbiased methodology and our articles are not intended to be financial advice. It does not constitute a recommendation to buy or sell any stock, and does not take account of your objectives, or your financial situation. We aim to bring you long-term focused analysis driven by fundamental data. Note that our analysis may not factor in the latest price-sensitive company announcements or qualitative material. Simply Wall St has no position in any stocks mentioned.
Valuation is complex, but we're here to simplify it.
Discover if Horizon Oil might be undervalued or overvalued with our detailed analysis, featuring fair value estimates, potential risks, dividends, insider trades, and its financial condition.
Access Free AnalysisHave feedback on this article? Concerned about the content? Get in touch with us directly. Alternatively, email editorial-team@simplywallst.com
About ASX:HZN
Horizon Oil
Engages in the exploration, development, and production of oil and gas properties in China, New Zealand, Australia, and Thailand.
Adequate balance sheet with questionable track record.
Similar Companies
Market Insights


Advertisement
Community Narratives
100% Patient Improvement in trial puts this $16M Biotech on the radar
Fair Value US$5.30|74.9% undervalued
JO
Community Contributor
PayPal's Future Growth Through Venmo and Merchant Solutions
Fair Value US$105.25|35.1% undervalued
ZW
Community Contributor
IREN's Bold Moves in Sustainable Bitcoin Mining & AI Data Centers
Fair Value US$26.54|1.5% undervalued
BL
Community Contributor