
Advertisement
- United States
- /
- Hospitality
- /
- NasdaqGS:JACK
An Intrinsic Calculation For Jack in the Box Inc. (NASDAQ:JACK) Suggests It's 35% Undervalued
Today we will run through one way of estimating the intrinsic value of Jack in the Box Inc. (NASDAQ:JACK) by projecting its future cash flows and then discounting them to today's value. I will use the Discounted Cash Flow (DCF) model. It may sound complicated, but actually it is quite simple!
Companies can be valued in a lot of ways, so we would point out that a DCF is not perfect for every situation. If you want to learn more about discounted cash flow, the rationale behind this calculation can be read in detail in the Simply Wall St analysis model.
Check out our latest analysis for Jack in the Box
Step by step through the calculation
We're using the 2-stage growth model, which simply means we take in account two stages of company's growth. In the initial period the company may have a higher growth rate and the second stage is usually assumed to have a stable growth rate. To start off with, we need to estimate the next ten years of cash flows. Where possible we use analyst estimates, but when these aren't available we extrapolate the previous free cash flow (FCF) from the last estimate or reported value. We assume companies with shrinking free cash flow will slow their rate of shrinkage, and that companies with growing free cash flow will see their growth rate slow, over this period. We do this to reflect that growth tends to slow more in the early years than it does in later years.
Generally we assume that a dollar today is more valuable than a dollar in the future, and so the sum of these future cash flows is then discounted to today's value:
10-year free cash flow (FCF) forecast
| 2020 | 2021 | 2022 | 2023 | 2024 | 2025 | 2026 | 2027 | 2028 | 2029 | |
| Levered FCF ($, Millions) | US$131.3m | US$132.1m | US$171.9m | US$177.2m | US$204.3m | US$223.8m | US$240.0m | US$253.4m | US$264.6m | US$274.2m |
| Growth Rate Estimate Source | Analyst x4 | Analyst x4 | Analyst x3 | Analyst x2 | Analyst x1 | Est @ 9.57% | Est @ 7.22% | Est @ 5.58% | Est @ 4.43% | Est @ 3.62% |
| Present Value ($, Millions) Discounted @ 8.8% | US$121 | US$112 | US$133 | US$126 | US$134 | US$135 | US$133 | US$129 | US$124 | US$118 |
("Est" = FCF growth rate estimated by Simply Wall St)
Present Value of 10-year Cash Flow (PVCF) = US$1.3b
After calculating the present value of future cash flows in the intial 10-year period, we need to calculate the Terminal Value, which accounts for all future cash flows beyond the first stage. The Gordon Growth formula is used to calculate Terminal Value at a future annual growth rate equal to the 10-year government bond rate of 1.7%. We discount the terminal cash flows to today's value at a cost of equity of 8.8%.
Terminal Value (TV)= FCF2029 × (1 + g) ÷ (r – g) = US$274m× (1 + 1.7%) ÷ 8.8%– 1.7%) = US$3.9b
Present Value of Terminal Value (PVTV)= TV / (1 + r)10= US$3.9b÷ ( 1 + 8.8%)10= US$1.7b
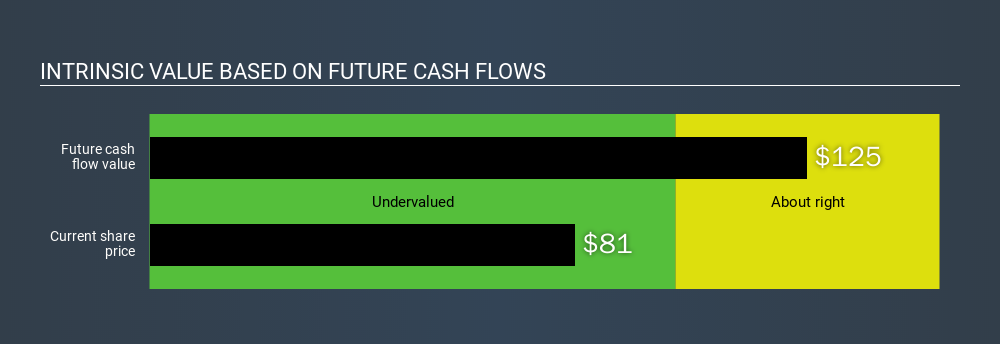
The total value is the sum of cash flows for the next ten years plus the discounted terminal value, which results in the Total Equity Value, which in this case is US$3.0b. The last step is to then divide the equity value by the number of shares outstanding. Compared to the current share price of US$81.0, the company appears quite undervalued at a 35% discount to where the stock price trades currently. Valuations are imprecise instruments though, rather like a telescope - move a few degrees and end up in a different galaxy. Do keep this in mind.
The assumptions
Now the most important inputs to a discounted cash flow are the discount rate, and of course, the actual cash flows. You don't have to agree with these inputs, I recommend redoing the calculations yourself and playing with them. The DCF also does not consider the possible cyclicality of an industry, or a company's future capital requirements, so it does not give a full picture of a company's potential performance. Given that we are looking at Jack in the Box as potential shareholders, the cost of equity is used as the discount rate, rather than the cost of capital (or weighted average cost of capital, WACC) which accounts for debt. In this calculation we've used 8.8%, which is based on a levered beta of 1.301. Beta is a measure of a stock's volatility, compared to the market as a whole. We get our beta from the industry average beta of globally comparable companies, with an imposed limit between 0.8 and 2.0, which is a reasonable range for a stable business.
Next Steps:
Whilst important, DCF calculation shouldn’t be the only metric you look at when researching a company. The DCF model is not a perfect stock valuation tool. Rather it should be seen as a guide to "what assumptions need to be true for this stock to be under/overvalued?" If a company grows at a different rate, or if its cost of equity or risk free rate changes sharply, the output can look very different. What is the reason for the share price to differ from the intrinsic value? For Jack in the Box, I've put together three important aspects you should further research:
- Financial Health: Does JACK have a healthy balance sheet? Take a look at our free balance sheet analysis with six simple checks on key factors like leverage and risk.
- Future Earnings: How does JACK's growth rate compare to its peers and the wider market? Dig deeper into the analyst consensus number for the upcoming years by interacting with our free analyst growth expectation chart.
- Other High Quality Alternatives: Are there other high quality stocks you could be holding instead of JACK? Explore our interactive list of high quality stocks to get an idea of what else is out there you may be missing!
PS. Simply Wall St updates its DCF calculation for every US stock every day, so if you want to find the intrinsic value of any other stock just search here.
If you spot an error that warrants correction, please contact the editor at editorial-team@simplywallst.com. This article by Simply Wall St is general in nature. It does not constitute a recommendation to buy or sell any stock, and does not take account of your objectives, or your financial situation. Simply Wall St has no position in the stocks mentioned.
We aim to bring you long-term focused research analysis driven by fundamental data. Note that our analysis may not factor in the latest price-sensitive company announcements or qualitative material. Thank you for reading.
 mitchell_lawler
The Foxhole
The crowd thinks AI winners will be the labs behind the models. I think an easier pick is hiding in payments, and Stripe just spent US$7 billion proving it.
87
LeverageIsLovely
Lithography. Packaging. Memory. Foundry. Will be the tolls.
darius_xnnrd
What's up with Stripe? They want to acquire PayPal. Now OpenRouter. They are onto something.
About NasdaqGS:JACK
Jack in the Box
Develops, operates, and franchises quick-service restaurants (QSR) in the United States.
Undervalued with moderate growth potential.
Similar Companies
Market Insights

Advertisement
Weekly Picks
RI


Rick_Orford on Starfighters Space ·
The 1960s Fighter Jet That Could Crack Open a $20 Billion Satellite Market
Fair Value:US$519.0% undervalued
38 followersusers have followed this narrative
2 commentsusers have commented on this narrative
7 likesusers have liked this narrative
FU


FundamentalFlow on Vertiv Holdings Co ·
The Short and Long Term Compounder of Liquid Cooling industry.
Fair Value:US$45035.0% undervalued
68 followersusers have followed this narrative
0 commentsusers have commented on this narrative
13 likesusers have liked this narrative
JO


John_Eric on SPX Technologies ·
I Fell in Love With a Data-Center Cooling Stock. Then I Opened the Filings.
Fair Value:US$2037.2% overvalued
32 followersusers have followed this narrative
2 commentsusers have commented on this narrative
11 likesusers have liked this narrative
TR


tripledub on GQG Partners ·
The Cheap Genius Problem
Fair Value:AU$3.2154.7% undervalued
37 followersusers have followed this narrative
0 commentsusers have commented on this narrative
24 likesusers have liked this narrative
Recently Updated Narratives
AS


AstrisCorporateAdvisory on Sodick ·
Entering the value-creation phase
Fair Value:JP¥1.44k24.1% overvalued
2 followersusers have followed this narrative
0 commentsusers have commented on this narrative
0 likesusers have liked this narrative
AS

AstrisCorporateAdvisory on AS ONE ·
Setting conservative expectations for FY3/27
Fair Value:JP¥2.11k11.6% overvalued
1 followerusers have followed this narrative
0 commentsusers have commented on this narrative
0 likesusers have liked this narrative
FU

FundamentalFlow on Nebius Group ·
Excellent Growth, But Valuation Tells Us A Different Story.
Fair Value:US$2804.0% undervalued
1 followerusers have followed this narrative
0 commentsusers have commented on this narrative
0 likesusers have liked this narrative
Popular Narratives
OS


oscargarcia on NVIDIA ·
The company that went from selling GPUs to gamers to becoming the AI arms dealer of the 21st century.
Fair Value:US$28019.6% undervalued
319 followersusers have followed this narrative
9 commentsusers have commented on this narrative
16 likesusers have liked this narrative
CU

CubanEros on Microsoft ·
A wonderful business at reasonable price.
Fair Value:US$419.9114.4% overvalued
174 followersusers have followed this narrative
0 commentsusers have commented on this narrative
9 likesusers have liked this narrative
KI

KiwiInvest on Amazon.com ·
Amazon's high growth, high tech segments propel its profits, while traditional segments plod along
Fair Value:US$475.0945.0% undervalued
199 followersusers have followed this narrative
1 commentusers have commented on this narrative
8 likesusers have liked this narrative
Trending Discussion
JA
james_rxfd8 on Starfighters Space ·
How is this different to Virgin Orbit, which didn’t seem to work out, with a very similar plan?
4
|2
GE

george_b177x on Bloom Energy ·
Brilliant analysis. Great company with proven product and service!
1
|1