


Key Takeaways
- Persistent supply chain and cost pressures, delayed mass-market launches, and reduced incentives threaten Rivian’s margins and growth prospects in a shrinking premium EV market.
- High cash burn, intensifying competition, and continual R&D demands risk further dilution, margin compression, and challenges to long-term profitability.
- Strategic partnerships, operational improvements, and expansion into new market segments are strengthening Rivian’s growth outlook while enabling greater profitability and resilience against industry risks.
Catalysts
About Rivian Automotive- Designs, develops, manufactures, and sells electric vehicles and accessories.
- Despite achieving its second consecutive quarter of positive gross profit, Rivian continues to face elevated input cost pressures stemming from persistent supply chain vulnerabilities, intensifying trade disputes, and rising tariffs on critical components like batteries and rare earth materials. These challenges are likely to increase cost of goods sold and compress net margins over the next several years, particularly as U.S. production of battery cells for the R2 platform will not come online until 2027, leaving Rivian exposed to ongoing import tariffs and cost volatility.
- The company’s delivered volumes and revenue outlook are increasingly constrained by declining consumer affordability and reduced government incentives for electric vehicles, as higher interest rates and a less supportive regulatory environment threaten to shrink Rivian’s addressable market for premium EVs. This pressure is exacerbated by the delay in launching mass-market vehicles like the R2, restricting top-line growth and risking missed volume ramp targets.
- Rivian’s ongoing high cash burn rate, combined with ambitious capital expenditures for plant expansions and vertical integration, raises the specter of further shareholder dilution or heavy reliance on incremental debt. With adjusted EBITDA projected to remain negative even as revenues grow, the risk of long-term earnings dilution and depressed EPS is significant.
- Industry competition continues to intensify, with legacy automakers and well-capitalized Chinese EV brands investing aggressively in both battery technology and autonomy. Rivian risks both customer attrition and heavy price pressure if it cannot differentiate its offerings or keep pace with technological advancements, leading to further gross margin compression and stalling revenue per vehicle.
- The company’s autonomy and AI platforms, while marketing highlights, may demand continually escalating research and development spending to remain competitive in a rapid innovation cycle. As advances in battery technology, propulsion, and autonomy by competitors threaten to outpace Rivian’s in-house developments, ongoing capital requirements could erode long-term profitability and burden free cash flow.
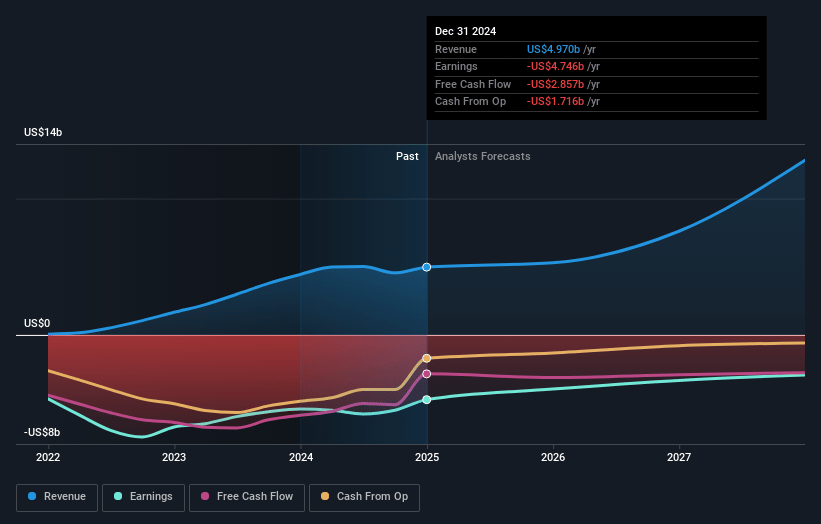
Rivian Automotive Future Earnings and Revenue Growth
Assumptions
How have these above catalysts been quantified?- This narrative explores a more pessimistic perspective on Rivian Automotive compared to the consensus, based on a Fair Value that aligns with the bearish cohort of analysts.
- The bearish analysts are assuming Rivian Automotive's revenue will grow by 20.4% annually over the next 3 years.
- The bearish analysts are not forecasting that Rivian Automotive will become profitable in next 3 years. To represent the Analyst Price Target as a Future PE Valuation we will estimate Rivian Automotive's profit margin will increase from -76.8% to the average US Auto industry of 5.3% in 3 years.
- If Rivian Automotive's profit margin were to converge on the industry average, you could expect earnings to reach $466.2 million (and earnings per share of $0.32) by about July 2028, up from $-3.8 billion today. The analysts are largely in agreement about this estimate.
- In order for the above numbers to justify the price target of the more bearish analyst cohort, the company would need to trade at a PE ratio of 36.1x on those 2028 earnings, up from -4.4x today. This future PE is greater than the current PE for the US Auto industry at 15.7x.
- Analysts expect the number of shares outstanding to grow by 7.0% per year for the next 3 years.
- To value all of this in today's terms, we will use a discount rate of 11.6%, as per the Simply Wall St company report.
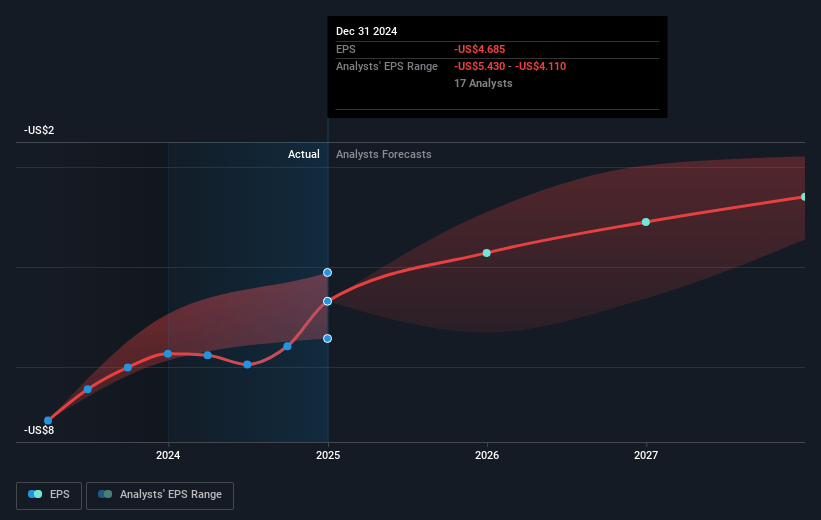
Rivian Automotive Future Earnings Per Share Growth
Risks
What could happen that would invalidate this narrative?- Rivian’s strategic joint venture with Volkswagen Group provides both significant capital infusion—up to four point five billion dollars including a one billion dollar direct equity investment at a substantial premium to the current stock price—and access to VW’s global scale, which could meaningfully accelerate product development and revenue growth opportunities, thus supporting long-term earnings potential.
- Positive and improving gross profitability, with the company delivering a second consecutive quarter of positive gross profit driven by disciplined cost control, operational efficiencies, and rising software and services revenues, signals increasing margin resilience and suggests a credible path to consistent net profitability as vehicle scale improves.
- The imminent launch of the R2 platform at a forty-five thousand dollar starting price opens a significantly larger total addressable market below the current R1 price point, which could dramatically boost revenue growth and operating leverage as production scales across multiple plants in the United States.
- Continuous investment and innovation in Rivian’s vertically integrated autonomy platform and the data flywheel approach for AI-driven autonomous driving features are positioning the company to unlock future high-margin software subscription revenue streams, thereby supplementing vehicle sales and improving long-term earnings quality.
- Robust liquidity, with seven point two billion dollars in cash and significant additional committed capital from government and corporate partners, combined with proactive supply chain localization and progress toward U.S. battery cell manufacturing, enhances Rivian’s flexibility to weather macroeconomic headwinds and regulatory changes, reducing risk to both short
- and long-term financial stability.
Valuation
How have all the factors above been brought together to estimate a fair value?- The assumed bearish price target for Rivian Automotive is $8.25, which represents two standard deviations below the consensus price target of $14.79. This valuation is based on what can be assumed as the expectations of Rivian Automotive's future earnings growth, profit margins and other risk factors from analysts on the more bearish end of the spectrum.
- However, there is a degree of disagreement amongst analysts, with the most bullish reporting a price target of $23.0, and the most bearish reporting a price target of just $7.05.
- In order for you to agree with the bearish analysts, you'd need to believe that by 2028, revenues will be $8.7 billion, earnings will come to $466.2 million, and it would be trading on a PE ratio of 36.1x, assuming you use a discount rate of 11.6%.
- Given the current share price of $14.02, the bearish analyst price target of $8.25 is 70.0% lower. Despite analysts expecting the underlying buisness to improve, they seem to believe the market's expectations are too high.
- We always encourage you to reach your own conclusions though. So sense check these analyst numbers against your own assumptions and expectations based on your understanding of the business and what you believe is probable.
How well do narratives help inform your perspective?
Disclaimer
AnalystLowTarget is a tool utilizing a Large Language Model (LLM) that ingests data on consensus price targets, forecasted revenue and earnings figures, as well as the transcripts of earnings calls to produce qualitative analysis. The narratives produced by AnalystLowTarget are general in nature and are based solely on analyst data and publicly-available material published by the respective companies. These scenarios are not indicative of the company's future performance and are exploratory in nature. Simply Wall St has no position in the company(s) mentioned. Simply Wall St may provide the securities issuer or related entities with website advertising services for a fee, on an arm's length basis. These relationships have no impact on the way we conduct our business, the content we host, or how our content is served to users. The price targets and estimates used are consensus data, and do not constitute a recommendation to buy or sell any stock, and they do not take account of your objectives, or your financial situation. Note that AnalystLowTarget's analysis may not factor in the latest price-sensitive company announcements or qualitative material.


