- South Africa
- /
- Pharma
- /
- JSE:AIP
Adcock Ingram Holdings (JSE:AIP) jumps 16% this week, though earnings growth is still tracking behind three-year shareholder returns


By buying an index fund, you can roughly match the market return with ease. But if you buy good businesses at attractive prices, your portfolio returns could exceed the average market return. For example, the Adcock Ingram Holdings Limited (JSE:AIP) share price is up 47% in the last three years, clearly besting the market return of around 9.4% (not including dividends). However, more recent returns haven't been as impressive as that, with the stock returning just 26% in the last year, including dividends.
Since it's been a strong week for Adcock Ingram Holdings shareholders, let's have a look at trend of the longer term fundamentals.
View our latest analysis for Adcock Ingram Holdings
To paraphrase Benjamin Graham: Over the short term the market is a voting machine, but over the long term it's a weighing machine. One imperfect but simple way to consider how the market perception of a company has shifted is to compare the change in the earnings per share (EPS) with the share price movement.
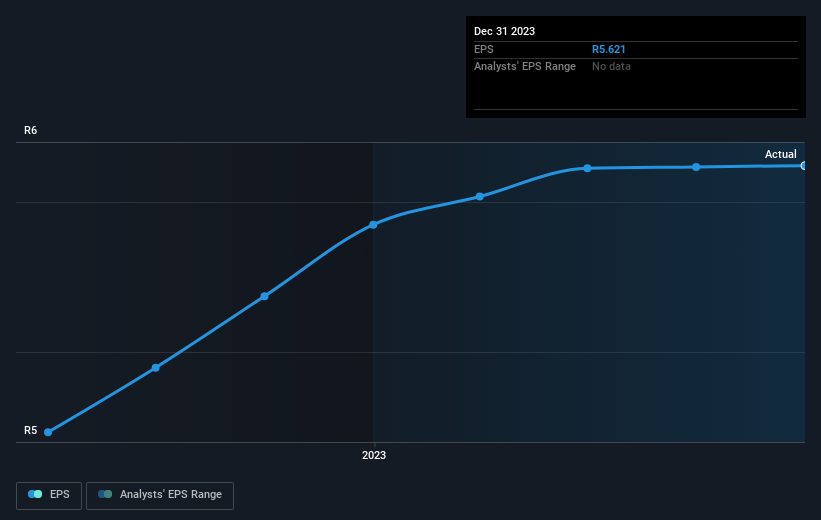
Adcock Ingram Holdings was able to grow its EPS at 18% per year over three years, sending the share price higher. This EPS growth is higher than the 14% average annual increase in the share price. Therefore, it seems the market has moderated its expectations for growth, somewhat. This cautious sentiment is reflected in its (fairly low) P/E ratio of 11.13.
The image below shows how EPS has tracked over time (if you click on the image you can see greater detail).
This free interactive report on Adcock Ingram Holdings' earnings, revenue and cash flow is a great place to start, if you want to investigate the stock further.
What About Dividends?
When looking at investment returns, it is important to consider the difference between total shareholder return (TSR) and share price return. The TSR is a return calculation that accounts for the value of cash dividends (assuming that any dividend received was reinvested) and the calculated value of any discounted capital raisings and spin-offs. So for companies that pay a generous dividend, the TSR is often a lot higher than the share price return. As it happens, Adcock Ingram Holdings' TSR for the last 3 years was 68%, which exceeds the share price return mentioned earlier. The dividends paid by the company have thusly boosted the total shareholder return.
A Different Perspective
We're pleased to report that Adcock Ingram Holdings shareholders have received a total shareholder return of 26% over one year. And that does include the dividend. That's better than the annualised return of 7% over half a decade, implying that the company is doing better recently. Given the share price momentum remains strong, it might be worth taking a closer look at the stock, lest you miss an opportunity. While it is well worth considering the different impacts that market conditions can have on the share price, there are other factors that are even more important. Case in point: We've spotted 1 warning sign for Adcock Ingram Holdings you should be aware of.
If you are like me, then you will not want to miss this free list of undervalued small caps that insiders are buying.
Please note, the market returns quoted in this article reflect the market weighted average returns of stocks that currently trade on South African exchanges.
New: Manage All Your Stock Portfolios in One Place
We've created the ultimate portfolio companion for stock investors, and it's free.
• Connect an unlimited number of Portfolios and see your total in one currency
• Be alerted to new Warning Signs or Risks via email or mobile
• Track the Fair Value of your stocks
Have feedback on this article? Concerned about the content? Get in touch with us directly. Alternatively, email editorial-team (at) simplywallst.com.
This article by Simply Wall St is general in nature. We provide commentary based on historical data and analyst forecasts only using an unbiased methodology and our articles are not intended to be financial advice. It does not constitute a recommendation to buy or sell any stock, and does not take account of your objectives, or your financial situation. We aim to bring you long-term focused analysis driven by fundamental data. Note that our analysis may not factor in the latest price-sensitive company announcements or qualitative material. Simply Wall St has no position in any stocks mentioned.
About JSE:AIP
Adcock Ingram Holdings
Engages in the manufacture, marketing, and distribution of healthcare products to private and public sectors in Southern Africa and India.
Flawless balance sheet and fair value.
Market Insights

Community Narratives


