- South Africa
- /
- Metals and Mining
- /
- JSE:GFI
Three Things You Should Check Before Buying Gold Fields Limited (JSE:GFI) For Its Dividend


Today we'll take a closer look at Gold Fields Limited (JSE:GFI) from a dividend investor's perspective. Owning a strong business and reinvesting the dividends is widely seen as an attractive way of growing your wealth. Yet sometimes, investors buy a stock for its dividend and lose money because the share price falls by more than they earned in dividend payments.
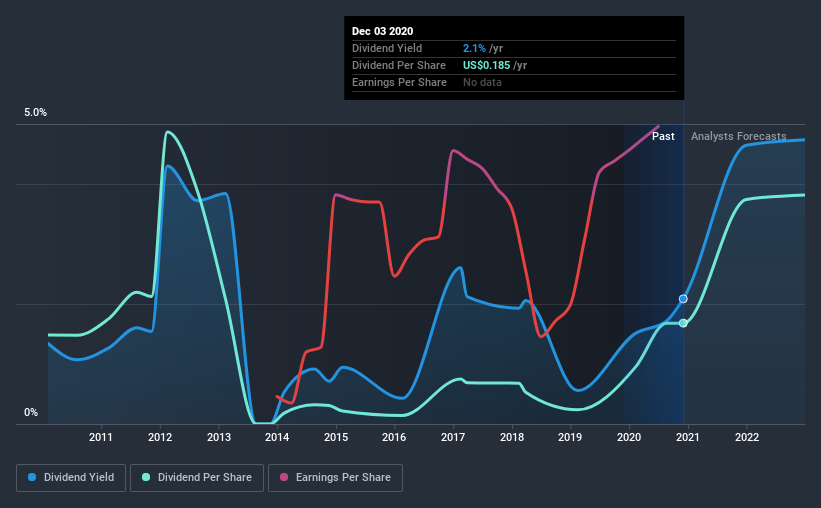
A 2.1% yield is nothing to get excited about, but investors probably think the long payment history suggests Gold Fields has some staying power. Remember that the recent share price drop will make Gold Fields's yield look higher, even though recent events might have impacted the company's prospects. Some simple analysis can offer a lot of insights when buying a company for its dividend, and we'll go through this below.
Explore this interactive chart for our latest analysis on Gold Fields!
Payout ratios
Dividends are usually paid out of company earnings. If a company is paying more than it earns, then the dividend might become unsustainable - hardly an ideal situation. So we need to form a view on if a company's dividend is sustainable, relative to its net profit after tax. In the last year, Gold Fields paid out 57% of its profit as dividends. A payout ratio above 50% generally implies a business is reaching maturity, although it is still possible to reinvest in the business or increase the dividend over time.
In addition to comparing dividends against profits, we should inspect whether the company generated enough cash to pay its dividend. Gold Fields' cash payout ratio last year was 18%. Cash flows are typically lumpy, but this looks like an appropriately conservative payout. It's positive to see that Gold Fields' dividend is covered by both profits and cash flow, since this is generally a sign that the dividend is sustainable, and a lower payout ratio usually suggests a greater margin of safety before the dividend gets cut.
We update our data on Gold Fields every 24 hours, so you can always get our latest analysis of its financial health, here.
Dividend Volatility
From the perspective of an income investor who wants to earn dividends for many years, there is not much point buying a stock if its dividend is regularly cut or is not reliable. Gold Fields has been paying dividends for a long time, but for the purpose of this analysis, we only examine the past 10 years of payments. The dividend has been cut on at least one occasion historically. During the past 10-year period, the first annual payment was US$0.2 in 2010, compared to US$0.2 last year. This works out to be a compound annual growth rate (CAGR) of approximately 1.3% a year over that time. The dividends haven't grown at precisely 1.3% every year, but this is a useful way to average out the historical rate of growth.
We're glad to see the dividend has risen, but with a limited rate of growth and fluctuations in the payments, we don't think this is an attractive combination.
Dividend Growth Potential
Given that the dividend has been cut in the past, we need to check if earnings are growing and if that might lead to stronger dividends in the future. Strong earnings per share (EPS) growth might encourage our interest in the company despite fluctuating dividends, which is why it's great to see Gold Fields has grown its earnings per share at 77% per annum over the past five years. With recent, rapid earnings per share growth and a payout ratio of 57%, this business looks like an interesting prospect if earnings are reinvested effectively.
We'd also point out that Gold Fields issued a meaningful number of new shares in the past year. Trying to grow the dividend when issuing new shares reminds us of the ancient Greek tale of Sisyphus - perpetually pushing a boulder uphill. Companies that consistently issue new shares are often suboptimal from a dividend perspective.
Conclusion
To summarise, shareholders should always check that Gold Fields' dividends are affordable, that its dividend payments are relatively stable, and that it has decent prospects for growing its earnings and dividend. Gold Fields' payout ratios are within a normal range for the average corporation, and we like that its cashflow was stronger than reported profits. We were also glad to see it growing earnings, but it was concerning to see the dividend has been cut at least once in the past. Gold Fields has a number of positive attributes, but it falls slightly short of our (admittedly high) standards. Were there evidence of a strong moat or an attractive valuation, it could still be well worth a look.
Investors generally tend to favour companies with a consistent, stable dividend policy as opposed to those operating an irregular one. Meanwhile, despite the importance of dividend payments, they are not the only factors our readers should know when assessing a company. Taking the debate a bit further, we've identified 3 warning signs for Gold Fields that investors need to be conscious of moving forward.
Looking for more high-yielding dividend ideas? Try our curated list of dividend stocks with a yield above 3%.
If you decide to trade Gold Fields, use the lowest-cost* platform that is rated #1 Overall by Barron’s, Interactive Brokers. Trade stocks, options, futures, forex, bonds and funds on 135 markets, all from a single integrated account. Promoted
If you're looking to trade Gold Fields, open an account with the lowest-cost platform trusted by professionals, Interactive Brokers.
With clients in over 200 countries and territories, and access to 160 markets, IBKR lets you trade stocks, options, futures, forex, bonds and funds from a single integrated account.
Enjoy no hidden fees, no account minimums, and FX conversion rates as low as 0.03%, far better than what most brokers offer.
Sponsored ContentNew: Manage All Your Stock Portfolios in One Place
We've created the ultimate portfolio companion for stock investors, and it's free.
• Connect an unlimited number of Portfolios and see your total in one currency
• Be alerted to new Warning Signs or Risks via email or mobile
• Track the Fair Value of your stocks
This article by Simply Wall St is general in nature. It does not constitute a recommendation to buy or sell any stock, and does not take account of your objectives, or your financial situation. We aim to bring you long-term focused analysis driven by fundamental data. Note that our analysis may not factor in the latest price-sensitive company announcements or qualitative material. Simply Wall St has no position in any stocks mentioned.
*Interactive Brokers Rated Lowest Cost Broker by StockBrokers.com Annual Online Review 2020
Have feedback on this article? Concerned about the content? Get in touch with us directly. Alternatively, email editorial-team@simplywallst.com.
About JSE:GFI
Gold Fields
Operates as a gold producer with reserves and resources in Australia, South Africa, Ghana, Peru, Chile, and Canada.
Outstanding track record with excellent balance sheet.
Similar Companies
Market Insights

Community Narratives

