- South Africa
- /
- Insurance
- /
- JSE:SNT
The 66% return delivered to Santam's (JSE:SNT) shareholders actually lagged YoY earnings growth


By buying an index fund, you can roughly match the market return with ease. But many of us dare to dream of bigger returns, and build a portfolio ourselves. For example, Santam Ltd (JSE:SNT) shareholders have seen the share price rise 31% over three years, well in excess of the market return (4.9%, not including dividends). However, more recent returns haven't been as impressive as that, with the stock returning just 26% in the last year, including dividends.
The past week has proven to be lucrative for Santam investors, so let's see if fundamentals drove the company's three-year performance.
Check out our latest analysis for Santam
While markets are a powerful pricing mechanism, share prices reflect investor sentiment, not just underlying business performance. One way to examine how market sentiment has changed over time is to look at the interaction between a company's share price and its earnings per share (EPS).
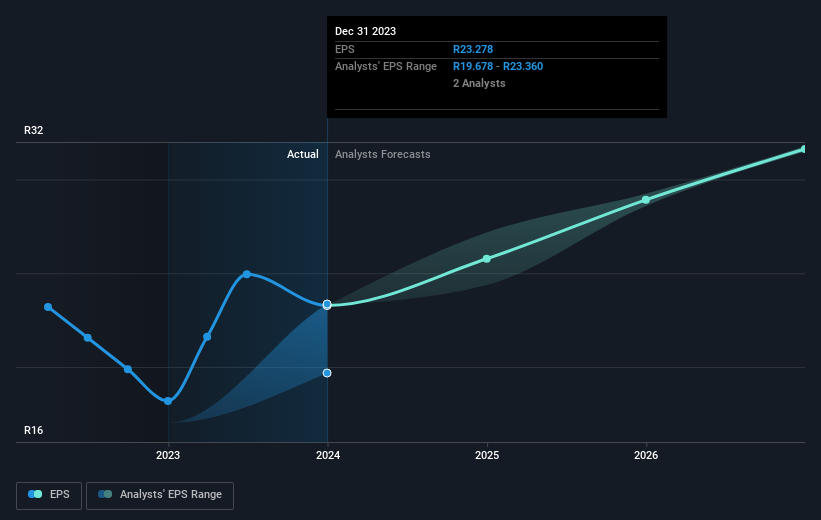
During three years of share price growth, Santam achieved compound earnings per share growth of 97% per year. This EPS growth is higher than the 10% average annual increase in the share price. So one could reasonably conclude that the market has cooled on the stock.
The image below shows how EPS has tracked over time (if you click on the image you can see greater detail).
It is of course excellent to see how Santam has grown profits over the years, but the future is more important for shareholders. Take a more thorough look at Santam's financial health with this free report on its balance sheet.
What About Dividends?
It is important to consider the total shareholder return, as well as the share price return, for any given stock. The TSR is a return calculation that accounts for the value of cash dividends (assuming that any dividend received was reinvested) and the calculated value of any discounted capital raisings and spin-offs. Arguably, the TSR gives a more comprehensive picture of the return generated by a stock. In the case of Santam, it has a TSR of 66% for the last 3 years. That exceeds its share price return that we previously mentioned. The dividends paid by the company have thusly boosted the total shareholder return.
A Different Perspective
We're pleased to report that Santam shareholders have received a total shareholder return of 26% over one year. Of course, that includes the dividend. That's better than the annualised return of 9% over half a decade, implying that the company is doing better recently. Someone with an optimistic perspective could view the recent improvement in TSR as indicating that the business itself is getting better with time. While it is well worth considering the different impacts that market conditions can have on the share price, there are other factors that are even more important. To that end, you should be aware of the 1 warning sign we've spotted with Santam .
If you like to buy stocks alongside management, then you might just love this free list of companies. (Hint: many of them are unnoticed AND have attractive valuation).
Please note, the market returns quoted in this article reflect the market weighted average returns of stocks that currently trade on South African exchanges.
New: Manage All Your Stock Portfolios in One Place
We've created the ultimate portfolio companion for stock investors, and it's free.
• Connect an unlimited number of Portfolios and see your total in one currency
• Be alerted to new Warning Signs or Risks via email or mobile
• Track the Fair Value of your stocks
Have feedback on this article? Concerned about the content? Get in touch with us directly. Alternatively, email editorial-team (at) simplywallst.com.
This article by Simply Wall St is general in nature. We provide commentary based on historical data and analyst forecasts only using an unbiased methodology and our articles are not intended to be financial advice. It does not constitute a recommendation to buy or sell any stock, and does not take account of your objectives, or your financial situation. We aim to bring you long-term focused analysis driven by fundamental data. Note that our analysis may not factor in the latest price-sensitive company announcements or qualitative material. Simply Wall St has no position in any stocks mentioned.
About JSE:SNT
Santam
Provides various general insurance products for individuals and businesses in South Africa, rest of Africa, Southeast Asia, India, the Middle East, and internationally.
Adequate balance sheet average dividend payer.

