
Quote of the Week: “Buy land, they’re not making it anymore.” – Mark Twain
Last week’s newsletter was an introduction to Real Estate Investment Trusts.
This week, we’re getting a little more technical and having a look at the qualitative factors that investors can consider when evaluating a REIT.
We will also take a look at the approaches typically used to value and compare REITs, and what management teams can do to increase yields over time.
🎧 Would you prefer to listen to these insights? You can find the audio version on our Spotify, Apple Podcasts or our YouTube!
What Happened in Markets this Week?
Here’s a quick summary of what’s been going on:
-
📈Goldman Sachs strategists think the era of hot returns for the S&P 500 is over. ( Axios )
- What’s our take?
- There’s more to investing than the S&P 500 - or forecasts.
- Goldman’s portfolio strategy team reckons the S&P 500 index is likely to return around 3% a year over the next decade - compared to 13% a year over the last decade.
- Interestingly, similar forecasts were made for pretty much the same reasons nearly 10 years ago. The argument was that high valuations almost always led to low returns - which was true. Others argued that there were structural factors that justified higher valuations - which turned out to be correct.
- The returns of the last decade have been driven by very different companies than the ones that existed during the previous 100 years. The big tech companies that dominate the index today are far more profitable and well-capitalized than the manufacturing, energy, and other companies that made up the bulk of the index in the past.
- This doesn’t mean Goldman’s forecast will turn out to be wrong - or right. The future is always full of unknowns, but one really stands out right now: what will the effect of AI and automation be on economic growth and corporate profits? Some believe these technologies will tank the economy, while others believe they will lead to 10% global GDP growth. Those two outcomes would lead to very different returns for the S&P 500.
- The good news is that you don’t have to invest in the S&P 500 index. Individual stocks can and do outperform the index - but it helps if you buy them at a price that gives you potential upside. You just need to be patient and wait for the rare opportunities when they arise.
- What’s our take?
-
⛏️ Newmont misses profit estimates on rising costs ( Reuters )
- What’s our take?
- Mining costs have an uncanny ability to keep up with the gold price.
- Although Newmont missed EPS estimates, the company did report its highest quarterly profit since 2019. That’s great, but with the gold price up nearly 90% in that time, shareholders may have been hoping for more. Like many gold miners, Newmont has barely made a profit over the last 10 years - while the share count has doubled.
- Gold mining gets more expensive each year, and while the price of gold rises and falls, the cost of getting it out of the ground only goes up. Profits increase when the gold price rises, but seem to evaporate as soon as it goes sideways.
- For investors, owning the metal itself has been a better bet o ver the last 20 years. Could it be different this time? Possibly - if the gold price keeps rising and/or if the sector re-rates over an extended period. If you missed it, we covered gold and gold mining shares in May.
- What’s our take?
-
🔋 Arkansas may be sitting on top of enough lithium to power the world’s EVs ( Forbes )
- What’s our take?
- For commodities, the solution to higher prices is often higher prices. Let me explain.
- Researchers estimate that a deposit in Southern Arkansas holds 5.1 million to 19 million tons of lithium brine. The study was conducted via a new technique that uses machine learning and geological data to map deposits. The upper end of that estimate would be nine times the projected EV demand in 2030.
- Extracting the lithium might be a challenge though, as the deposit is deep underground. ExxonMobil is already drilling exploratory wells and hopes to begin production in 2027 - but is still developing part of the process to separate lithium from the water. Whether the project is feasible will depend on the cost of extraction and the price of lithium.
- Only a few years ago, a global shortage of lithium was anticipated, leading to a 500% rally in the price. That attracted more investment and exploration, and now new deposits are being announced all over the place. This is often the case with commodities, particularly those that are actually quite plentiful. Gold is a different story, as the ‘low-hanging fruit’ was picked years ago.
- What’s our take?
-
🚘 GM beats estimates and raises outlook on strong SUV sales ( Bloomberg )
- What’s our take?
- GM may have mastered the hybrid-electric-business model.
- General Motors reported better-than-expected quarterly results and raised guidance for the full year. The results stood out as many legacy and EV automakers are experiencing a slump in sales. GM’s winners were SUVs and pickups, which also kept the average sale price above $49k.
- The company is also making gains in the US EV market. Its EV sales were up 60% in the year to September, compared to 11% for the industry. GM’s Q3 market share was also the highest it’s ever been at 9.3%, and second only to Tesla.
- CEO Mary Barra said GM’s EV business is on track to become profitable by the end of the year, and it still plans to phase out internal combustion engine vehicles by 2035.
- GM could be in a unique position now. While the EV industry is in a price war and many players aren’t profitable, GM’s EV business is just about breaking even. On top of that, its gas-guzzling SUVs are providing valuable cash flow.
- What’s our take?
-
🇨🇦 Bank of Canada goes big with 50 bps rate cut ( Reuters )
- What’s our take?
- Canadians might breathe a sigh of relief at the further rate reductions, but these latest cuts indicate that economic growth is struggling.
- The Canadian benchmark rate now sits at 3.75%, down 125bps from the high of 5%. The four cuts in a row since June have occurred because demand has been muted, sales are sluggish, and consumer sentiment is tepid.
- Now that September annual inflation came in at 1.6%, the BoC says its focus has changed from lowering inflation to maintaining its inflation target. Remember, inflation is another word for “currency debasement”…
- Odds are that another cut will occur at the December meeting, the question is just whether it will be 25bps or 50bps.
- What’s our take?
-
🌏 Investors pile into emerging-market funds that cut out China ( FT )
- What’s our take?
- When investors are keen to invest in certain areas and avoid others, money managers are happy to oblige.
- If an emerging market ETF follows the MSCI index for developing economy stocks, it will be heavily weighted towards China. At the peak of the pandemic, Chinese stocks made up 40% of the index, but now only make up 25%.
- However, these days, investors want to reduce their exposure to China given the escalating tensions and risks of further sanctions. To accommodate this trend, the number of ex-China emerging market funds has doubled to 70 over the past 2 years.
- It’s a very different type of market, given the idiosyncratic risks relating to heavy government intervention. If you’re keen to follow a similar investing approach with your emerging markets exposure, you’ve now got way more options than you did 2 years ago.
- What’s our take?
🔎 Analyzing REITs
To analyze a REIT, you need to go beyond the standard financial statements and look at the underlying assets.
✨ This information is typically available on the company website - if it isn’t, that’s probably a red flag.
Before you do that, there are a few things to check on the Simply Wall St company report:
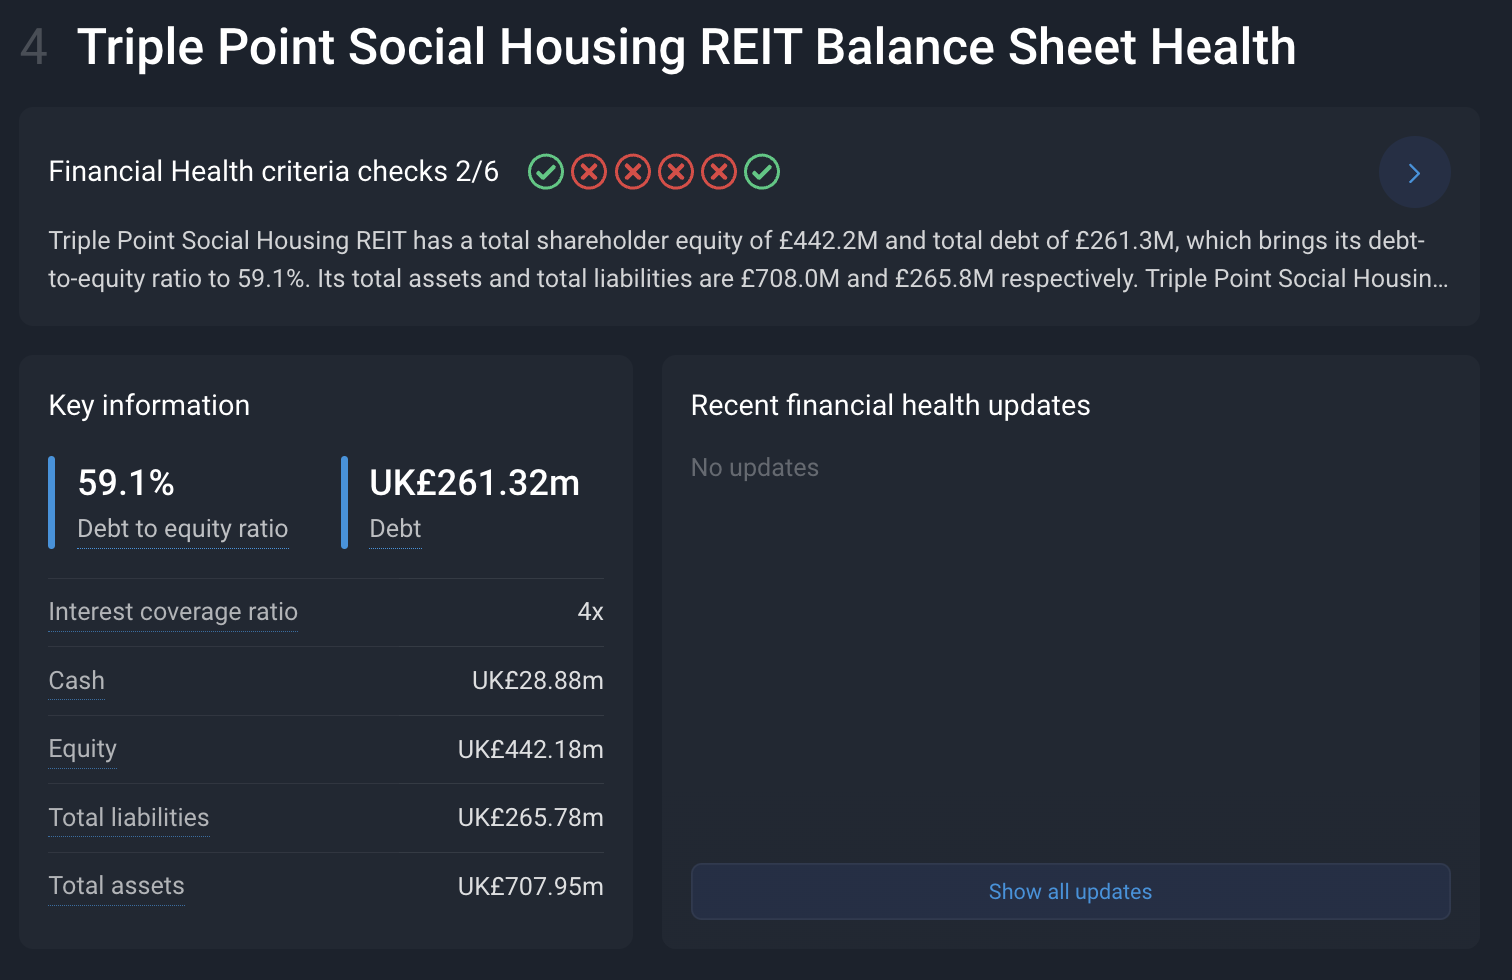
- 💰 Section 4 - Financial Health
The key numbers here are:
- The debt to equity ratio . Ratios below 80% are usually quite manageable. If the ratio is closer to, or above 100% you’ll want to pay closer attention to the company’s ability to finance and extend loans.
- The interest coverage ratio. This tells you how well interest payments are covered by operating income. Higher is better, and you really want to see this above 3x.
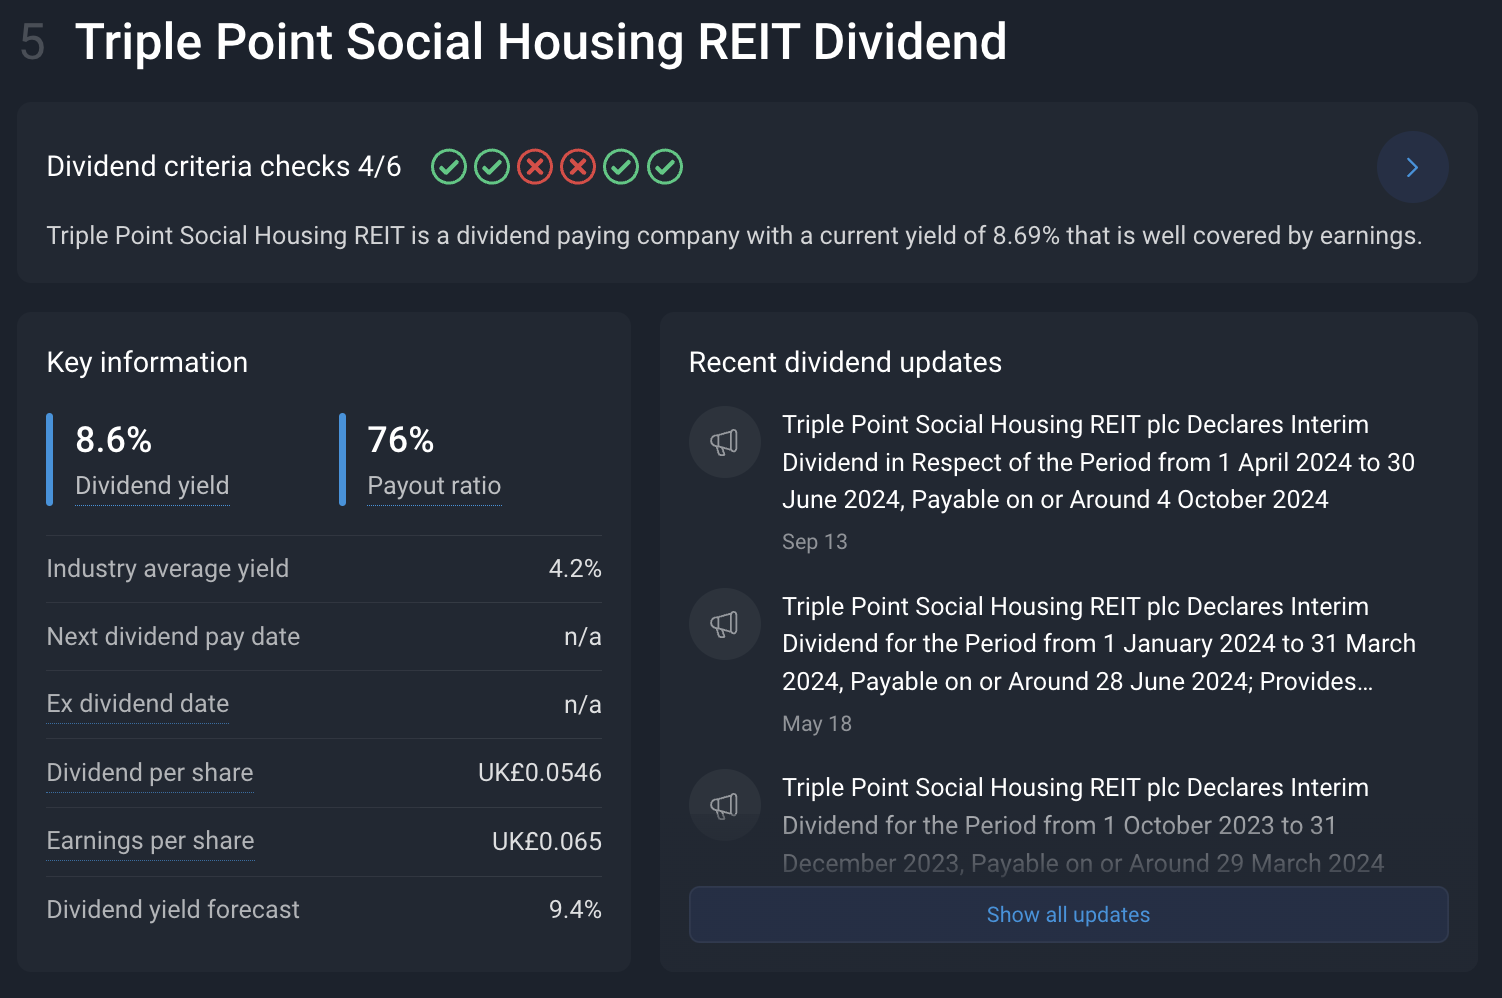
- 🤑 Section 5 - Dividends
- The dividend yield is the easiest way to compare REITs.
- The dividend yield forecast shows you whether analysts expect the dividend to increase in the near term.
- The dividend payout ratio shows you how much of the net income is paid out as a dividend.
- The dividend history chart will show you how stable dividend payments are, and whether they have been increasing.
Now, if you head down to 'Other Information' at the bottom of the report, you’ll find the company website. The info you’re looking for will usually be in a section titled ‘Investors’.
Qualitative Factors
Most REITs are good at providing detailed information about the portfolio, activities, and funding. They may also provide non-GAAP data relevant to real estate for more context.
So here are some of the qualitative factors they’ll provide information on, and what to look for.
🏘️ Property Portfolio - Are They High Quality Assets And Diversified?
The first thing to assess is the types of properties, where they are located, and their age and condition. You’ll also want to know about new acquisitions, developments, upgrades and disposals.
🤝 Tenants, Leases, and Occupancy - Who are they leasing to?
The reliability of future income and dividends depends on a REITs tenants. Default rates are obviously lower for large, well capitalized companies than they are for independent companies. If tenants are publicly listed, it's also easier to evaluate their credit worthiness.
The types of leases a landlord is able to sign will determine the extra expenses that will need to be covered by the REIT.
- Triple net leases are the gold standard, as the tenant is responsible for taxes, insurance and other operating costs.
- Single and double net leases shift some costs to the landlord.
- Gross leases are all-inclusive and the tenant pays a fixed rental amount with no other monthly bills. A gross lease can result in higher income for the landlord, but additional expenses are less predictable.
✨ Occupancy rates reflect demand for real estate. Even more important are trends in occupancy.
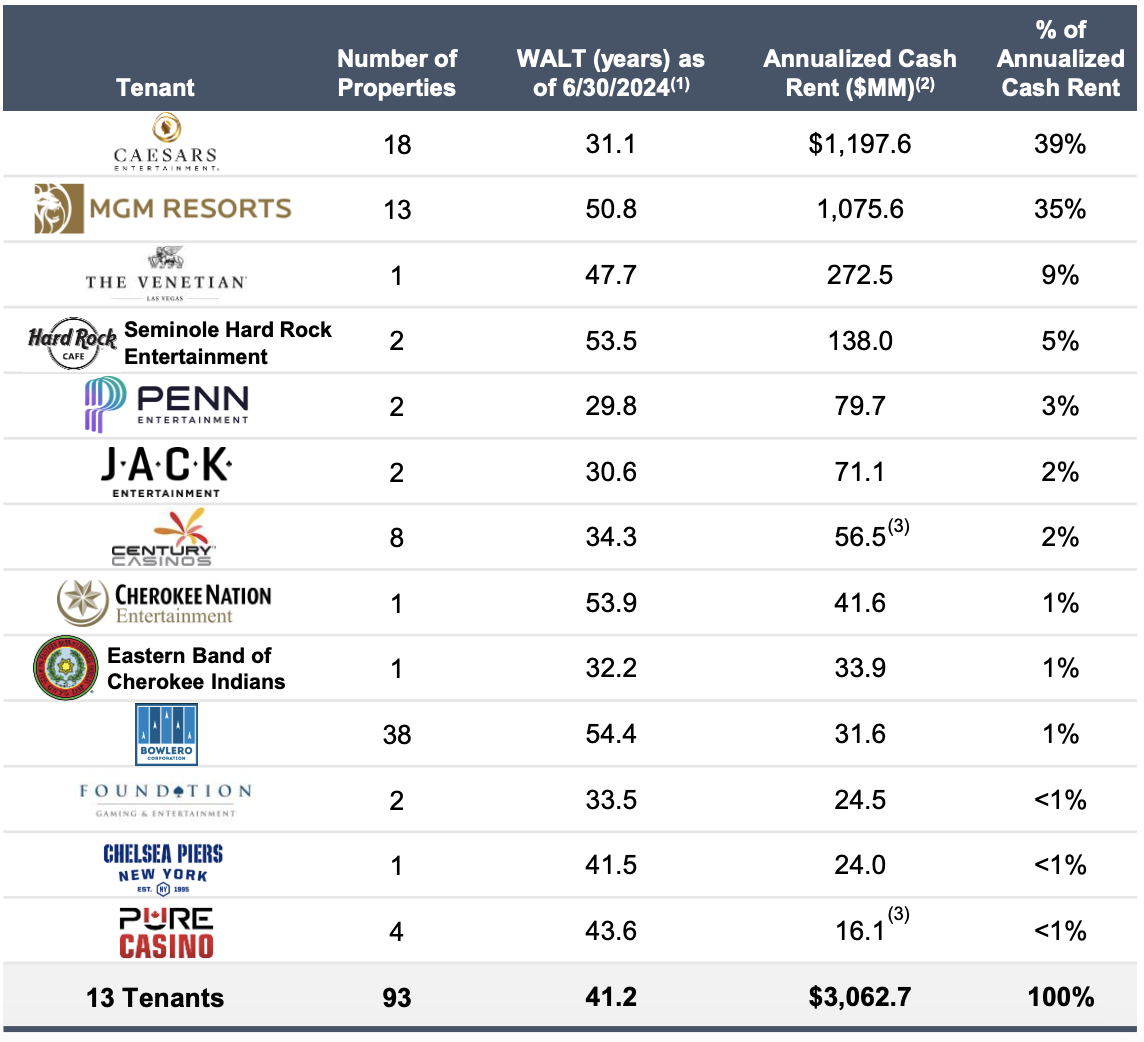
Real estate companies can diversify in several ways, including by location (by city, state or country), and exposure to individual tenants and industries. Some REITs limit their exposure to individual companies to a percentage of total revenue, which has been particularly important for retail REITs.
There is a trade-off with diversification, as better performance often occurs when companies have been quite focussed. If you do invest in highly concentrated REITs (like VICI Properties, below), you can add your own diversification by investing in several REITs.
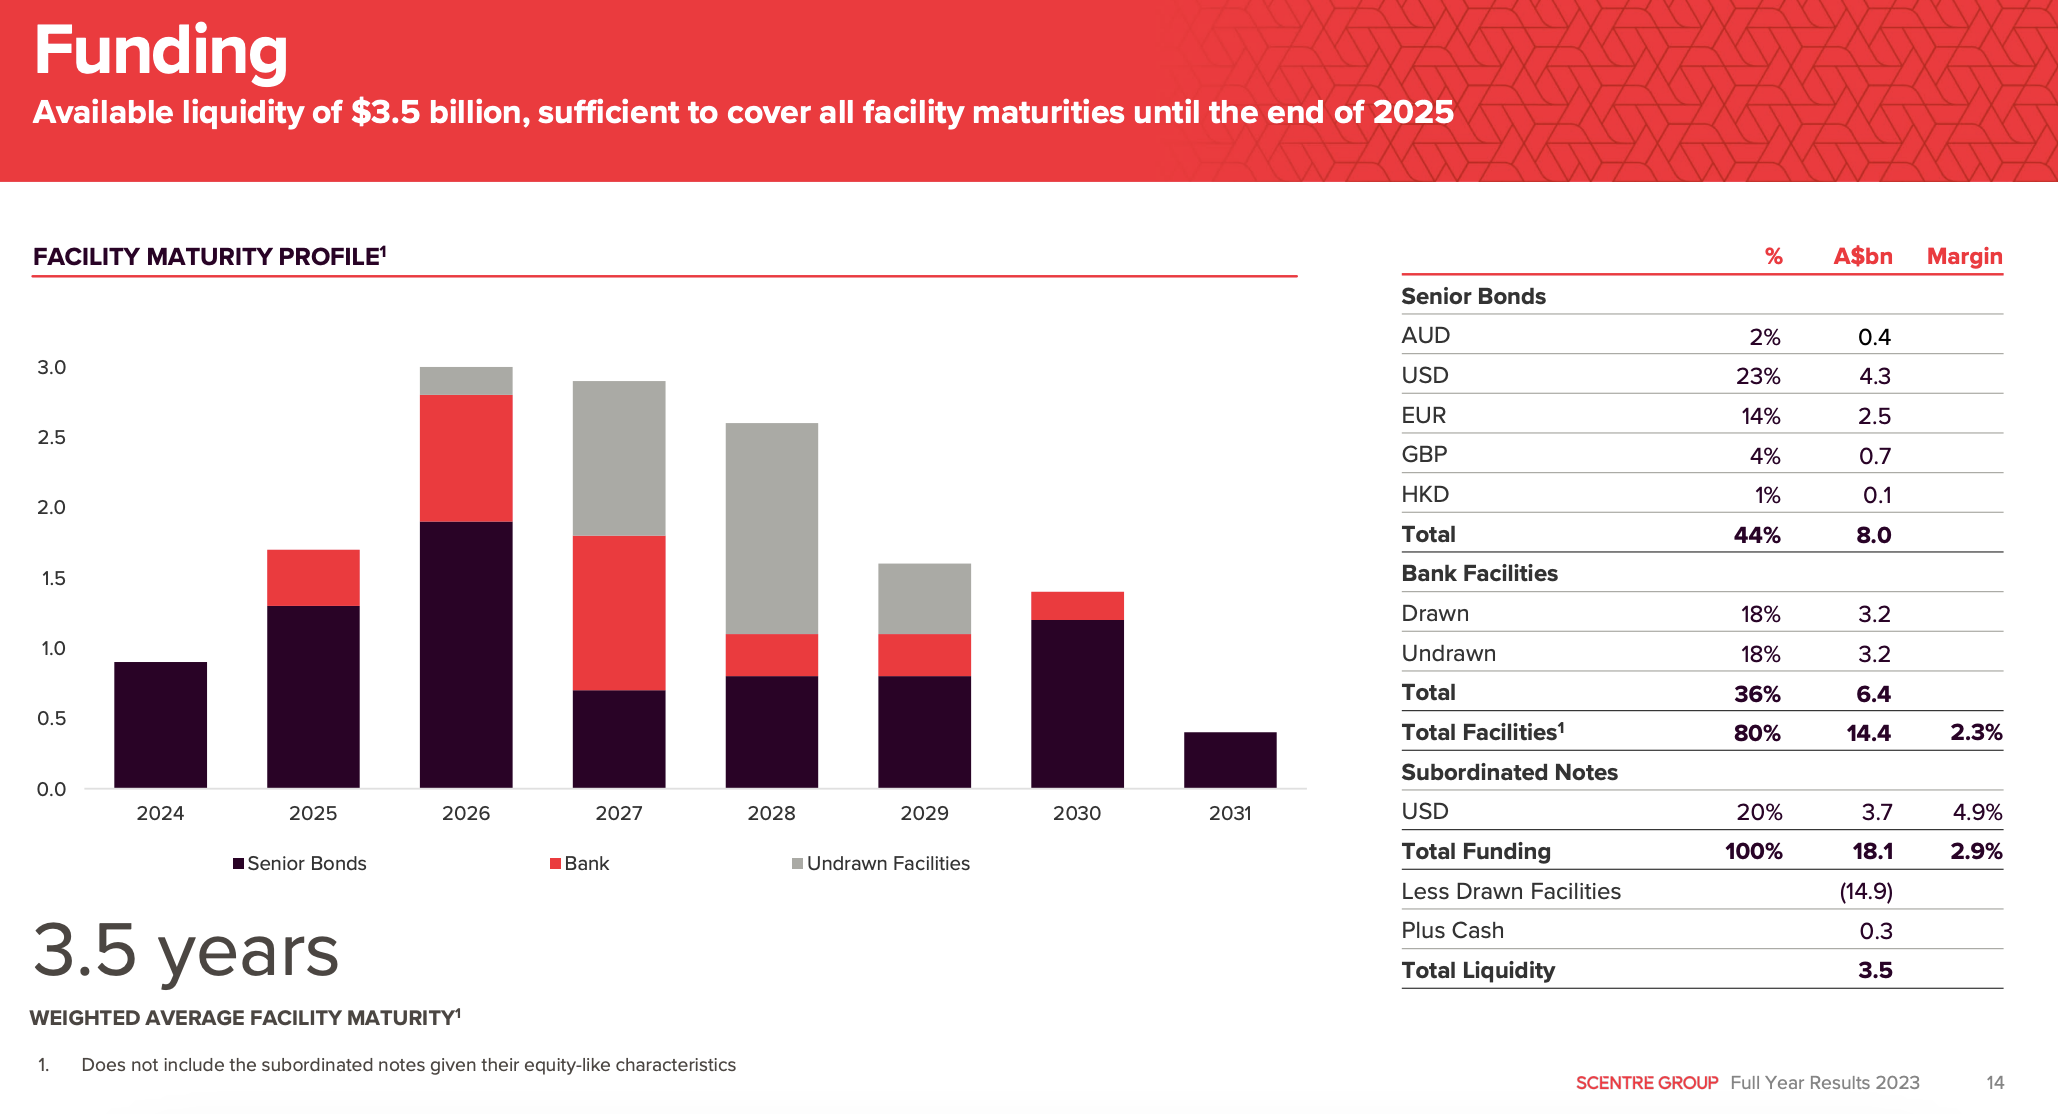
💸 Debt - Do They Manage Their Leverage Wisely?
REITs use debt extensively, and the interest rates and maturity profile are crucial factors to consider.
You will want to know when loans need to be refinanced, and whether the refinancing is likely to be at a higher or lower rate.
REIT Valuation - Use multiple approaches
Valuation methods for REITs fall into three categories:
- Price multiples and ratios
- Cash flow models
- Net asset value (NAV)
The approach you use will depend on your objectives and time horizon - but it’s also worth using more than one approach.
🔢 Price Multiples And Ratios
Ratios are the easiest to calculate and are useful when comparing REITs.
- Share price/FFO per share is the equivalent of a P/E ratio.
- FFO (Funds From Operations) excludes depreciation, amortization, interest, and capital gains and losses from net income.
- FFO reflects the income generated from a REITs primary activity.
- Share price/AFFO per share is another variation.
- AFFO or adjusted funds from operations is calculated by subtracting recurring capital expenditures from FFO.
- This reflects the REITs capacity to pay dividends.
- Cap Rates reflect the yield on the underlying properties.
- Cap rates are calculated as NOI (net operating income)/property value
- NOI in turn is equal to operating income less expenses.
- Cap rates can be calculated for individual properties to compare portfolios owned by different REITs.
💵 Cash Flow Models
Cash flow models like discounted cash flow (DCF) and dividend discount model (DDM) are used to estimate fair value as the present value of expected cash flows.
Since most of a REIT’s income is paid out as a dividend, the DDM is particularly appropriate in this case.
The basic formula for DDM is: Dividend per share/(Discount rate - Dividend growth rate)
💰 Net Asset Value (NAV)
The NAV approach considers the market value of the underlying assets.
- Comparing the share price to the NAV per share gives you an idea of the margin of safety. This is where people are trying to buy $1 for 50 cents.
- Knowing the NAV also suggests the potential for gains or losses on the sale of properties.
🧾 Asset Values under GAAP vs IFRS
There is an important difference in the way REITs are obligated to value their assets, depending on where they are based. The different standards can have significant implications for the way income is reported.
-
🇺🇸 US companies report financials according to the Generally Accepted Accounting Principles (GAAP) standard.
- Under the GAAP standard, most assets, including property, are recorded at the original cost less depreciation.
- This means the book value of a property portfolio can be understated. This can result in large profits being reported when properties are sold.
-
🌐 Companies in the majority of other countries fall under the International Financial Reporting Standards (IFRS) standard.
- IFRS accounting allows a company to revalue assets at fair market value, provided the value can be reasonably estimated or calculated.
- This means the book value is more realistic. But it can also result in the value of properties being marked up or down, which is reported as a profit or loss on the income statement.
💡 The Insight: Look At How Management Plans To Increase NAV And Yield Over Time.
Last week, we mentioned the impact secular trends can have on yields. These trends drive demand, which underpins the rental yield of properties.
📈 REIT management teams can also increase income in several ways, including:
- Upgrading properties to attract tenants prepared to pay higher rents.
- Selling lower-yielding properties and redeploying the capital to higher-yielding properties.
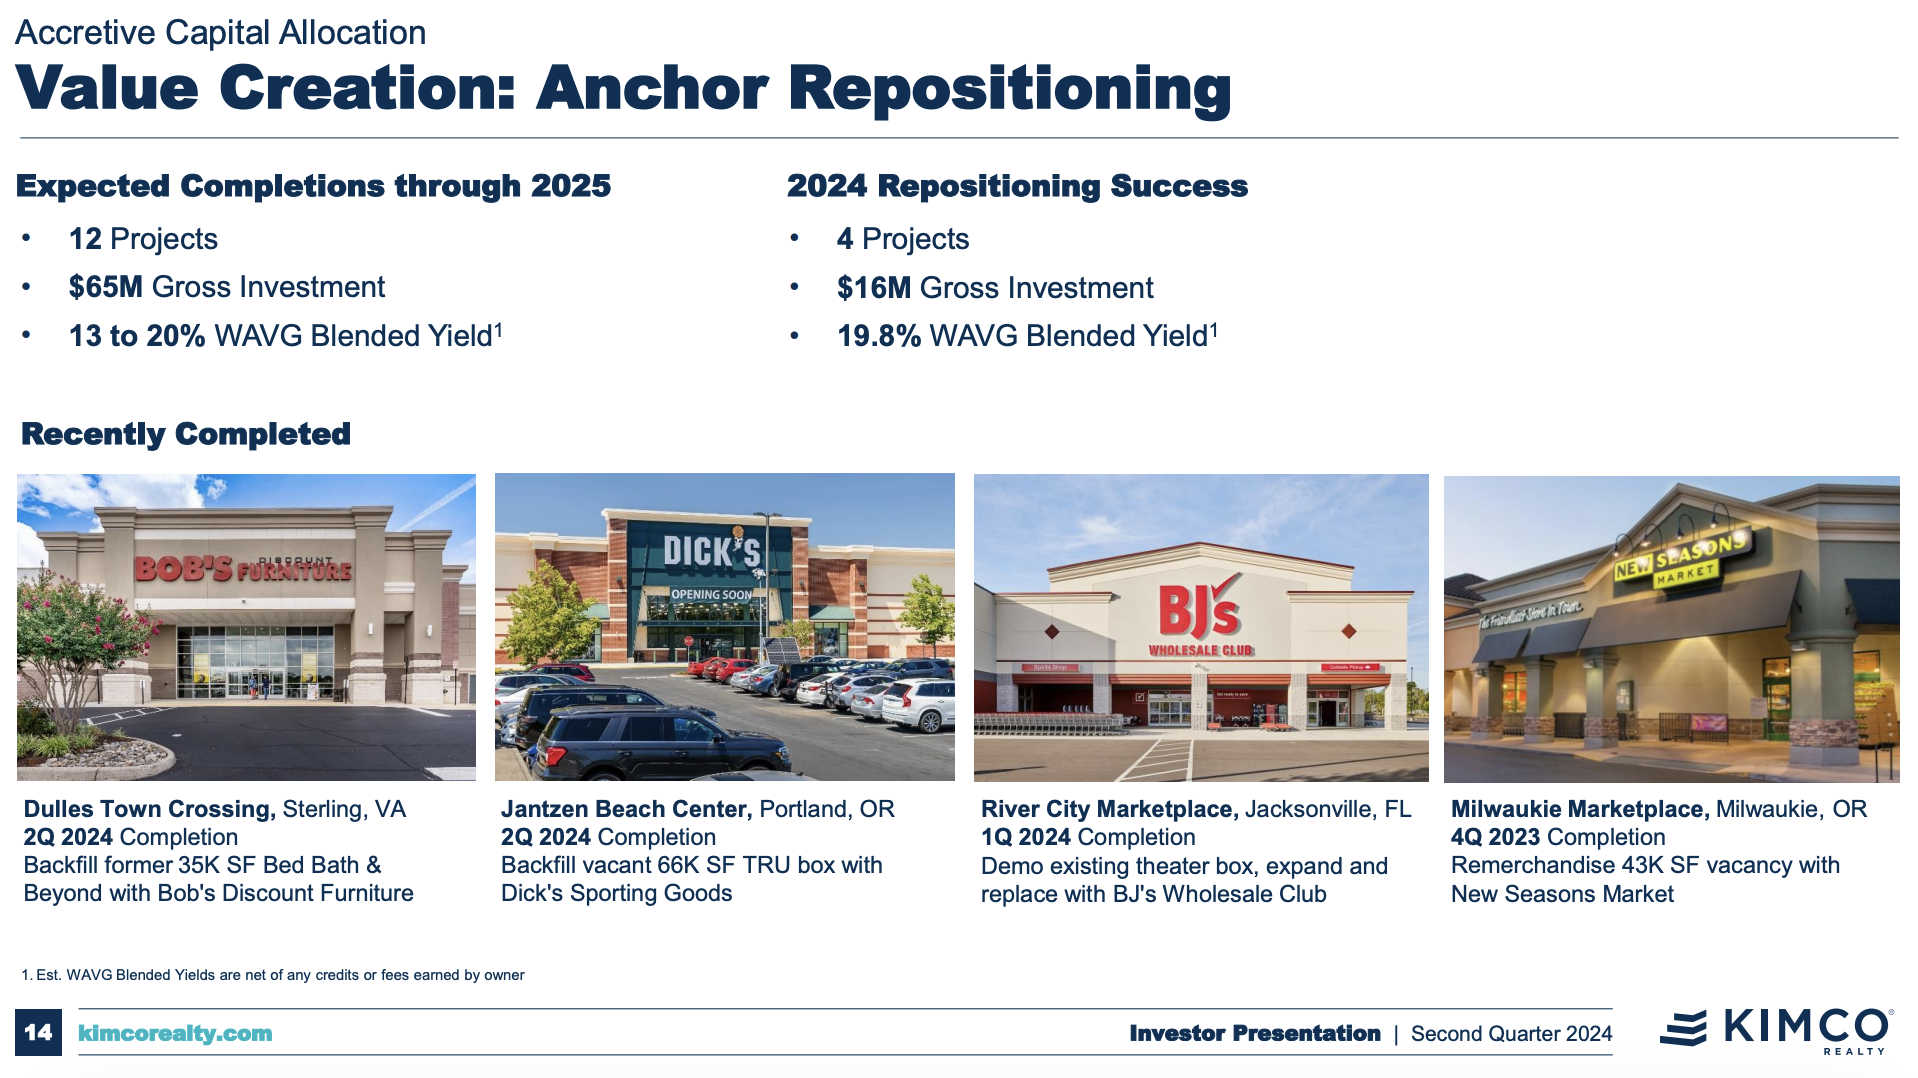
- Reposition or repurpose properties to cater to markets with higher demand.
- Provide more services to tenants.
- Increase leverage or refinance debt at lower interest rates.
📉 On the other hand, some factors can act as a drag on income and the distributions to shareholders:
- Management fees reduce the income available to shareholders.
- Badly managed maintenance schedules can lead to higher costs later, or to lower occupancy.
- Mistimed refinancing can also result in higher interest costs.
Taking a look at the management team’s ongoing strategy and activities can help you determine whether they are likely to enhance yields and Net Asset Values over time.
Key Events During The Next Week
It’s a big week for corporate earnings and economic data in Europe and the US.
Tuesday
- 🇺🇸 US JOLTs Job openings are forecast to fall to 7.8 million after an unexpected jump last month.
Wednesday
- 🇦🇺 Australia’s consumer inflation rate is expected to rise from 2.7% to 2.9%
- 🇪🇺 Eurozone economic data will be published on Wednesday and Thursday:
- The GDP Flash estimate is forecast to show growth rising to 1% in the year to September, compared to 0.6% in the year to June.
- Unemployment in Europe is expected to rise slightly, from 6.4% to 6.5%.
- 🇺🇸 The US ADP National Employment Report is forecast to show 129k new jobs, down from 143k in September.
- 🇺🇸 The first estimate for 3rd quarter US GDP growth is expected to be 3.3%, up from 3% in the second quarter.
Thursday
- 🇺🇸 US Core PCE Price data will be published. Consensus estimates are for annual inflation to remain at 2.7%, with the month-on-month increase also remaining steady at 0.1%.
- 🇺🇸 Personal income and spending data will also be published. Income is forecast to show a 0.2% increase, while spending is expected to be up 0.4%.
Friday
- 🇺🇸 More US employment data will be published. The unemployment rate is forecast to rise from 4.1% to 4.2%. Non-farm payrolls are forecast to fall to 180k, from 254k in September.
With 5 of the Magnificent 7 due to report, it’s the biggest week of earnings season. The Nasdaq website has a more comprehensive list, but the large caps include:
- Apple
- Microsoft
- Alphabet
- Amazon
- Meta Platforms
- Berkshire Hathaway
- Eli Lilly
- Visa Inc
- Exxon Mobil
- Mastercard
- AMD
- McDonald's
- Caterpillar
Have feedback on this article? Concerned about the content? Get in touch with us directly. Alternatively, email editorial-team@simplywallst.com
Simply Wall St analyst Richard Bowman and Simply Wall St have no position in any of the companies mentioned. This article is general in nature. Any comments below from SWS employees are their opinions only, should not be taken as financial advice and may not represent the views of Simply Wall St. Unless otherwise advised, SWS employees providing commentary do not own a position in any company mentioned in the article or in their comments.We provide analysis based on historical data and analyst forecasts only using an unbiased methodology and our articles are not intended to be financial advice. It does not constitute a recommendation to buy or sell any stock and does not take account of your objectives, or your financial situation. We aim to bring you long-term focused analysis driven by fundamental data. Note that our analysis may not factor in the latest price-sensitive company announcements or qualitative material.
Richard Bowman
Richard is an analyst, writer and investor based in Cape Town, South Africa. He has written for several online investment publications and continues to do so. Richard is fascinated by economics, financial markets and behavioral finance. He is also passionate about tools and content that make investing accessible to everyone.