
Advertisement
- South Africa
- /
- Insurance
- /
- JSE:OMU
Old Mutual (JSE:OMU) shareholders have earned a 2.7% CAGR over the last five years

The main aim of stock picking is to find the market-beating stocks. But even the best stock picker will only win with some selections. At this point some shareholders may be questioning their investment in Old Mutual Limited (JSE:OMU), since the last five years saw the share price fall 28%.
Now let's have a look at the company's fundamentals, and see if the long term shareholder return has matched the performance of the underlying business.
Check out our latest analysis for Old Mutual
While markets are a powerful pricing mechanism, share prices reflect investor sentiment, not just underlying business performance. One imperfect but simple way to consider how the market perception of a company has shifted is to compare the change in the earnings per share (EPS) with the share price movement.
While the share price declined over five years, Old Mutual actually managed to increase EPS by an average of 10% per year. Given the share price reaction, one might suspect that EPS is not a good guide to the business performance during the period (perhaps due to a one-off loss or gain). Alternatively, growth expectations may have been unreasonable in the past.
Due to the lack of correlation between the EPS growth and the falling share price, it's worth taking a look at other metrics to try to understand the share price movement.
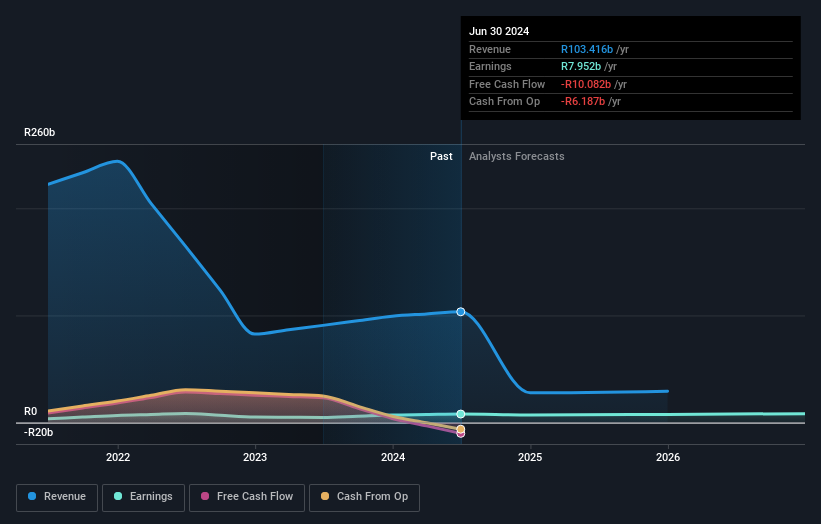
We note that the dividend has fallen in the last five years, so that may have contributed to the share price decline. On top of that, revenue has declined by 9.4% per year over the half decade; that could be a red flag for some investors.
You can see below how earnings and revenue have changed over time (discover the exact values by clicking on the image).
We know that Old Mutual has improved its bottom line over the last three years, but what does the future have in store? You can see how its balance sheet has strengthened (or weakened) over time in this free interactive graphic.
What About Dividends?
When looking at investment returns, it is important to consider the difference between total shareholder return (TSR) and share price return. The TSR is a return calculation that accounts for the value of cash dividends (assuming that any dividend received was reinvested) and the calculated value of any discounted capital raisings and spin-offs. It's fair to say that the TSR gives a more complete picture for stocks that pay a dividend. As it happens, Old Mutual's TSR for the last 5 years was 14%, which exceeds the share price return mentioned earlier. This is largely a result of its dividend payments!
A Different Perspective
Old Mutual shareholders gained a total return of 10% during the year. But that was short of the market average. The silver lining is that the gain was actually better than the average annual return of 3% per year over five year. This suggests the company might be improving over time. It's always interesting to track share price performance over the longer term. But to understand Old Mutual better, we need to consider many other factors. Even so, be aware that Old Mutual is showing 2 warning signs in our investment analysis , and 1 of those shouldn't be ignored...
Of course Old Mutual may not be the best stock to buy. So you may wish to see this free collection of growth stocks.
Please note, the market returns quoted in this article reflect the market weighted average returns of stocks that currently trade on South African exchanges.
New: AI Stock Screener & Alerts
Our new AI Stock Screener scans the market every day to uncover opportunities.
• Dividend Powerhouses (3%+ Yield)
• Undervalued Small Caps with Insider Buying
• High growth Tech and AI Companies
Or build your own from over 50 metrics.
Have feedback on this article? Concerned about the content? Get in touch with us directly. Alternatively, email editorial-team (at) simplywallst.com.
This article by Simply Wall St is general in nature. We provide commentary based on historical data and analyst forecasts only using an unbiased methodology and our articles are not intended to be financial advice. It does not constitute a recommendation to buy or sell any stock, and does not take account of your objectives, or your financial situation. We aim to bring you long-term focused analysis driven by fundamental data. Note that our analysis may not factor in the latest price-sensitive company announcements or qualitative material. Simply Wall St has no position in any stocks mentioned.
About JSE:OMU
Old Mutual
Provides financial services primarily in South Africa and rest of Africa.
Fair value with acceptable track record.
Similar Companies
Market Insights


Advertisement
Community Narratives
Alphabet: The Under-appreciated Compounder Hiding in Plain Sight
Fair Value US$282.83|32.8% undervalued
BL
Community Contributor
Planet Labs: At The Heart Of The Emerging New Space Boom
Fair Value US$11.31|45.4% undervalued
AN
Community Contributor
Exxon in Guyana 5 year forecast Low $135 to High $189
Fair Value US$174.00|37.0% undervalued
AG
Community Contributor