
Advertisement
- South Africa
- /
- Capital Markets
- /
- JSE:INL
The total return for Investec Group (JSE:INL) investors has risen faster than earnings growth over the last three years
It's been a soft week for Investec Group (JSE:INL) shares, which are down 10%. In contrast, the return over three years has been impressive. The share price marched upwards over that time, and is now 181% higher than it was. After a run like that some may not be surprised to see prices moderate. The fundamental business performance will ultimately dictate whether the top is in, or if this is a stellar buying opportunity.
Although Investec Group has shed R10.0b from its market cap this week, let's take a look at its longer term fundamental trends and see if they've driven returns.
View our latest analysis for Investec Group
While markets are a powerful pricing mechanism, share prices reflect investor sentiment, not just underlying business performance. One way to examine how market sentiment has changed over time is to look at the interaction between a company's share price and its earnings per share (EPS).
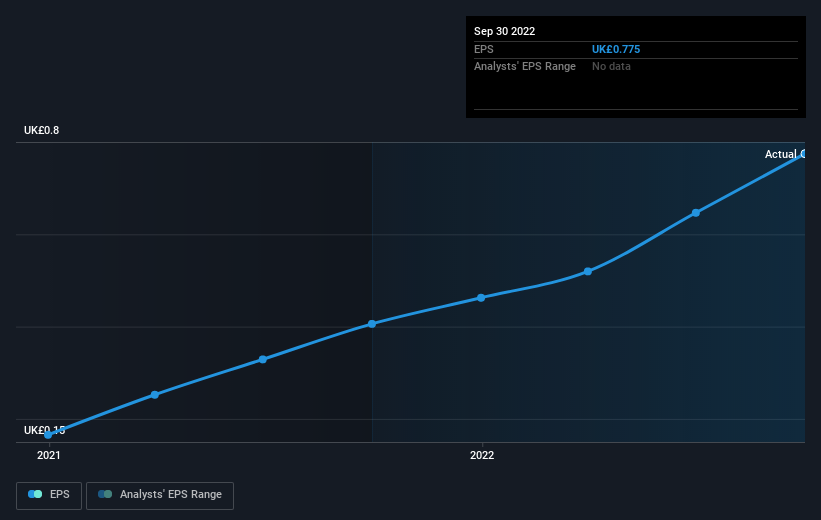
During three years of share price growth, Investec Group achieved compound earnings per share growth of 38% per year. We note that the 41% yearly (average) share price gain isn't too far from the EPS growth rate. Coincidence? Probably not. That suggests that the market sentiment around the company hasn't changed much over that time. Rather, the share price has approximately tracked EPS growth.
You can see below how EPS has changed over time (discover the exact values by clicking on the image).
It is of course excellent to see how Investec Group has grown profits over the years, but the future is more important for shareholders. Take a more thorough look at Investec Group's financial health with this free report on its balance sheet.
What About Dividends?
As well as measuring the share price return, investors should also consider the total shareholder return (TSR). The TSR is a return calculation that accounts for the value of cash dividends (assuming that any dividend received was reinvested) and the calculated value of any discounted capital raisings and spin-offs. It's fair to say that the TSR gives a more complete picture for stocks that pay a dividend. As it happens, Investec Group's TSR for the last 3 years was 226%, which exceeds the share price return mentioned earlier. And there's no prize for guessing that the dividend payments largely explain the divergence!
A Different Perspective
It's nice to see that Investec Group shareholders have received a total shareholder return of 23% over the last year. And that does include the dividend. That's better than the annualised return of 17% over half a decade, implying that the company is doing better recently. In the best case scenario, this may hint at some real business momentum, implying that now could be a great time to delve deeper. It's always interesting to track share price performance over the longer term. But to understand Investec Group better, we need to consider many other factors. Take risks, for example - Investec Group has 2 warning signs (and 1 which makes us a bit uncomfortable) we think you should know about.
If you would prefer to check out another company -- one with potentially superior financials -- then do not miss this free list of companies that have proven they can grow earnings.
Please note, the market returns quoted in this article reflect the market weighted average returns of stocks that currently trade on South African exchanges.
New: AI Stock Screener & Alerts
Our new AI Stock Screener scans the market every day to uncover opportunities.
• Dividend Powerhouses (3%+ Yield)
• Undervalued Small Caps with Insider Buying
• High growth Tech and AI Companies
Or build your own from over 50 metrics.
Have feedback on this article? Concerned about the content? Get in touch with us directly. Alternatively, email editorial-team (at) simplywallst.com.
This article by Simply Wall St is general in nature. We provide commentary based on historical data and analyst forecasts only using an unbiased methodology and our articles are not intended to be financial advice. It does not constitute a recommendation to buy or sell any stock, and does not take account of your objectives, or your financial situation. We aim to bring you long-term focused analysis driven by fundamental data. Note that our analysis may not factor in the latest price-sensitive company announcements or qualitative material. Simply Wall St has no position in any stocks mentioned.
About JSE:INL
Investec Group
Provides various financial products and services in South Africa, the United Kingdom, and internationally.
Adequate balance sheet average dividend payer.
Similar Companies
Market Insights

Advertisement
Community Narratives
Quality at a Premium. A time to watch, not to buy?
Fair Value US$154.56|29.3% undervalued
DA
Community Contributor
GRAB: The Super-App at the Heart of Southeast Asia’s Digital Boom
Fair Value US$6.60|7.0% undervalued
BL
Community Contributor
Verve Group to Surge with 51.61% Revenue Growth
Fair Value €6.00|65.0% undervalued
ME
Community Contributor