
Advertisement
- South Africa
- /
- Professional Services
- /
- JSE:PMV
What Is Primeserv Group's (JSE:PMV) P/E Ratio After Its Share Price Rocketed?

Primeserv Group (JSE:PMV) shareholders are no doubt pleased to see that the share price has had a great month, posting a 46% gain, recovering from prior weakness. The full year gain of 43% is pretty reasonable, too.
All else being equal, a sharp share price increase should make a stock less attractive to potential investors. In the long term, share prices tend to follow earnings per share, but in the short term prices bounce around in response to short term factors (which are not always obvious). The implication here is that deep value investors might steer clear when expectations of a company are too high. One way to gauge market expectations of a stock is to look at its Price to Earnings Ratio (PE Ratio). A high P/E ratio means that investors have a high expectation about future growth, while a low P/E ratio means they have low expectations about future growth.
See our latest analysis for Primeserv Group
How Does Primeserv Group's P/E Ratio Compare To Its Peers?
Primeserv Group's P/E of 3.09 indicates relatively low sentiment towards the stock. We can see in the image below that the average P/E (21.0) for companies in the professional services industry is higher than Primeserv Group's P/E.
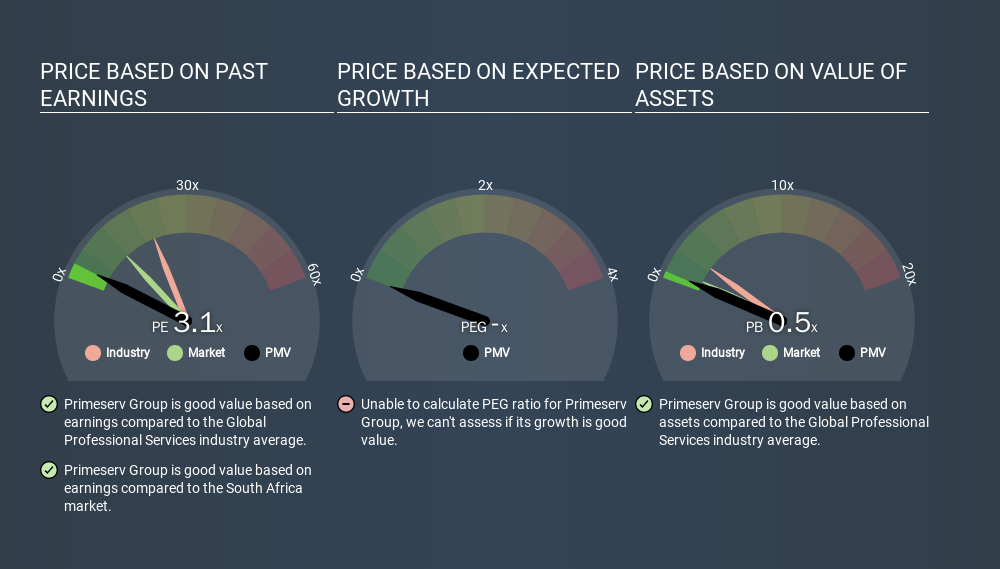
This suggests that market participants think Primeserv Group will underperform other companies in its industry. Since the market seems unimpressed with Primeserv Group, it's quite possible it could surprise on the upside. If you consider the stock interesting, further research is recommended. For example, I often monitor director buying and selling.
How Growth Rates Impact P/E Ratios
Generally speaking the rate of earnings growth has a profound impact on a company's P/E multiple. Earnings growth means that in the future the 'E' will be higher. That means unless the share price increases, the P/E will reduce in a few years. So while a stock may look expensive based on past earnings, it could be cheap based on future earnings.
Most would be impressed by Primeserv Group earnings growth of 15% in the last year. And its annual EPS growth rate over 5 years is 31%. So one might expect an above average P/E ratio.
A Limitation: P/E Ratios Ignore Debt and Cash In The Bank
It's important to note that the P/E ratio considers the market capitalization, not the enterprise value. Thus, the metric does not reflect cash or debt held by the company. Theoretically, a business can improve its earnings (and produce a lower P/E in the future) by investing in growth. That means taking on debt (or spending its cash).
Such expenditure might be good or bad, in the long term, but the point here is that the balance sheet is not reflected by this ratio.
How Does Primeserv Group's Debt Impact Its P/E Ratio?
With net cash of R11m, Primeserv Group has a very strong balance sheet, which may be important for its business. Having said that, at 15% of its market capitalization the cash hoard would contribute towards a higher P/E ratio.
The Bottom Line On Primeserv Group's P/E Ratio
Primeserv Group has a P/E of 3.1. That's below the average in the ZA market, which is 11.6. The net cash position gives plenty of options to the business, and the recent improvement in EPS is good to see. The below average P/E ratio suggests that market participants don't believe the strong growth will continue. What we know for sure is that investors are becoming less uncomfortable about Primeserv Group's prospects, since they have pushed its P/E ratio from 2.1 to 3.1 over the last month. If you like to buy stocks that could be turnaround opportunities, then this one might be a candidate; but if you're more sensitive to price, then you may feel the opportunity has passed.
Investors have an opportunity when market expectations about a stock are wrong. If it is underestimating a company, investors can make money by buying and holding the shares until the market corrects itself. We don't have analyst forecasts, but you might want to assess this data-rich visualization of earnings, revenue and cash flow.
Of course, you might find a fantastic investment by looking at a few good candidates. So take a peek at this free list of companies with modest (or no) debt, trading on a P/E below 20.
If you spot an error that warrants correction, please contact the editor at editorial-team@simplywallst.com. This article by Simply Wall St is general in nature. It does not constitute a recommendation to buy or sell any stock, and does not take account of your objectives, or your financial situation. Simply Wall St has no position in the stocks mentioned.
We aim to bring you long-term focused research analysis driven by fundamental data. Note that our analysis may not factor in the latest price-sensitive company announcements or qualitative material. Thank you for reading.
About JSE:PMV
Primeserv Group
Provides integrated business support services in South Africa.
Flawless balance sheet with solid track record and pays a dividend.
Market Insights

Advertisement
Community Narratives

Apple: A Dying Star with an Overpriced Valuation
Fair Value US$177.34|19.7% overvalued
IN
Community Contributor
Avino a case for USD$20 per share within 5 years (assuming $3,500 gold, $100 silver and $4 copper).
Fair Value CA$26.79|87.9% undervalued
AG
Community Contributor
Riding the Defense Boom RENK Sees Revenue Climb at 15% CAGR by FY 2029
Fair Value €69.87|24.5% undervalued
CH
Community Contributor