
Advertisement
- South Africa
- /
- Construction
- /
- JSE:SSK
Even With A 60% Surge, Cautious Investors Are Not Rewarding Stefanutti Stocks Holdings Limited's (JSE:SSK) Performance Completely

Stefanutti Stocks Holdings Limited (JSE:SSK) shares have continued their recent momentum with a 60% gain in the last month alone. The annual gain comes to 233% following the latest surge, making investors sit up and take notice.
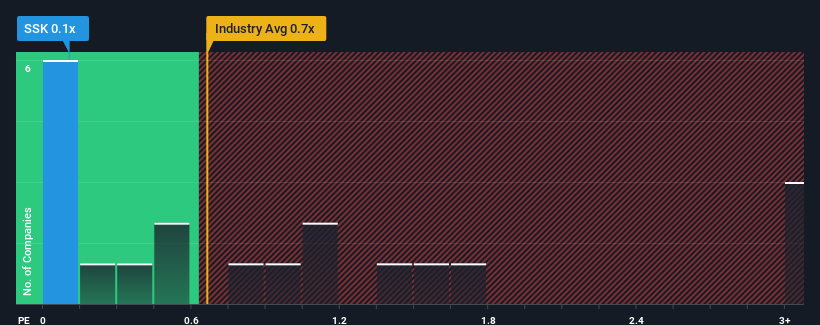
In spite of the firm bounce in price, it would still be understandable if you think Stefanutti Stocks Holdings is a stock with good investment prospects with a price-to-sales ratios (or "P/S") of 0.1x, considering almost half the companies in South Africa's Construction industry have P/S ratios above 0.9x. However, the P/S might be low for a reason and it requires further investigation to determine if it's justified.
Check out our latest analysis for Stefanutti Stocks Holdings
What Does Stefanutti Stocks Holdings' Recent Performance Look Like?
Revenue has risen firmly for Stefanutti Stocks Holdings recently, which is pleasing to see. Perhaps the market is expecting this acceptable revenue performance to take a dive, which has kept the P/S suppressed. If that doesn't eventuate, then existing shareholders have reason to be optimistic about the future direction of the share price.
Want the full picture on earnings, revenue and cash flow for the company? Then our free report on Stefanutti Stocks Holdings will help you shine a light on its historical performance.Is There Any Revenue Growth Forecasted For Stefanutti Stocks Holdings?
The only time you'd be truly comfortable seeing a P/S as low as Stefanutti Stocks Holdings' is when the company's growth is on track to lag the industry.
If we review the last year of revenue growth, the company posted a terrific increase of 17%. Pleasingly, revenue has also lifted 51% in aggregate from three years ago, thanks to the last 12 months of growth. Therefore, it's fair to say the revenue growth recently has been superb for the company.
This is in contrast to the rest of the industry, which is expected to grow by 10% over the next year, materially lower than the company's recent medium-term annualised growth rates.
In light of this, it's peculiar that Stefanutti Stocks Holdings' P/S sits below the majority of other companies. It looks like most investors are not convinced the company can maintain its recent growth rates.
What Does Stefanutti Stocks Holdings' P/S Mean For Investors?
Stefanutti Stocks Holdings' stock price has surged recently, but its but its P/S still remains modest. Typically, we'd caution against reading too much into price-to-sales ratios when settling on investment decisions, though it can reveal plenty about what other market participants think about the company.
Our examination of Stefanutti Stocks Holdings revealed its three-year revenue trends aren't boosting its P/S anywhere near as much as we would have predicted, given they look better than current industry expectations. Potential investors that are sceptical over continued revenue performance may be preventing the P/S ratio from matching previous strong performance. While recent revenue trends over the past medium-term suggest that the risk of a price decline is low, investors appear to perceive a likelihood of revenue fluctuations in the future.
We don't want to rain on the parade too much, but we did also find 4 warning signs for Stefanutti Stocks Holdings (2 are a bit unpleasant!) that you need to be mindful of.
It's important to make sure you look for a great company, not just the first idea you come across. So if growing profitability aligns with your idea of a great company, take a peek at this free list of interesting companies with strong recent earnings growth (and a low P/E).
New: Manage All Your Stock Portfolios in One Place
We've created the ultimate portfolio companion for stock investors, and it's free.
• Connect an unlimited number of Portfolios and see your total in one currency
• Be alerted to new Warning Signs or Risks via email or mobile
• Track the Fair Value of your stocks
Have feedback on this article? Concerned about the content? Get in touch with us directly. Alternatively, email editorial-team (at) simplywallst.com.
This article by Simply Wall St is general in nature. We provide commentary based on historical data and analyst forecasts only using an unbiased methodology and our articles are not intended to be financial advice. It does not constitute a recommendation to buy or sell any stock, and does not take account of your objectives, or your financial situation. We aim to bring you long-term focused analysis driven by fundamental data. Note that our analysis may not factor in the latest price-sensitive company announcements or qualitative material. Simply Wall St has no position in any stocks mentioned.
About JSE:SSK
Stefanutti Stocks Holdings
Operates as a construction company in South Africa and sub-Saharan Africa.
Good value with acceptable track record.
Similar Companies
Market Insights


Advertisement
Community Narratives
Nike's Direct-to-Consumer Focus Will Drive Future Growth
Fair Value US$87.90|18.2% undervalued
UN
Community Contributor
Novo Nordisk will dominate GLP-1 market with Ozempic and Wegovy growth
Fair Value US$89.59|12.1% undervalued
BE
Community Contributor
Rheinmetall could get 20-25% of EU-NATO 3%-GDP defence spending
Fair Value €7.57k|82.4% undervalued
NO
Community Contributor