- South Africa
- /
- Banks
- /
- JSE:NED
The one-year returns for Nedbank Group's (JSE:NED) shareholders have been favorable, yet its earnings growth was even better


The simplest way to invest in stocks is to buy exchange traded funds. But if you pick the right individual stocks, you could make more than that. For example, the Nedbank Group Limited (JSE:NED) share price is up 24% in the last 1 year, clearly besting the market return of around 0.8% (not including dividends). That's a solid performance by our standards! On the other hand, longer term shareholders have had a tougher run, with the stock falling 0.8% in three years.
Since it's been a strong week for Nedbank Group shareholders, let's have a look at trend of the longer term fundamentals.
Though if you're not interested in researching what drove NED's performance, we have a free list of interesting investing ideas to potentially inspire your next investment!
While markets are a powerful pricing mechanism, share prices reflect investor sentiment, not just underlying business performance. One imperfect but simple way to consider how the market perception of a company has shifted is to compare the change in the earnings per share (EPS) with the share price movement.
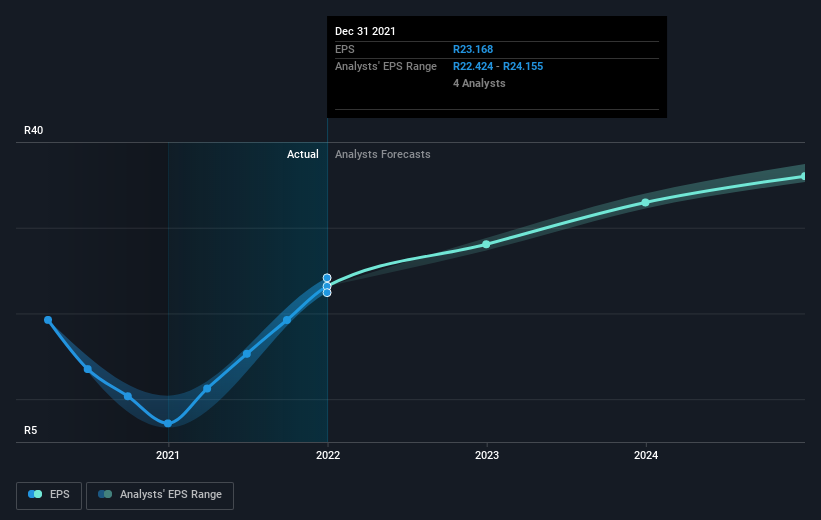
Nedbank Group was able to grow EPS by 223% in the last twelve months. This EPS growth is significantly higher than the 24% increase in the share price. So it seems like the market has cooled on Nedbank Group, despite the growth. Interesting. The caution is also evident in the lowish P/E ratio of 9.74.
You can see below how EPS has changed over time (discover the exact values by clicking on the image).
We know that Nedbank Group has improved its bottom line lately, but is it going to grow revenue? If you're interested, you could check this free report showing consensus revenue forecasts.
What About Dividends?
As well as measuring the share price return, investors should also consider the total shareholder return (TSR). Whereas the share price return only reflects the change in the share price, the TSR includes the value of dividends (assuming they were reinvested) and the benefit of any discounted capital raising or spin-off. So for companies that pay a generous dividend, the TSR is often a lot higher than the share price return. We note that for Nedbank Group the TSR over the last 1 year was 32%, which is better than the share price return mentioned above. The dividends paid by the company have thusly boosted the total shareholder return.
A Different Perspective
It's good to see that Nedbank Group has rewarded shareholders with a total shareholder return of 32% in the last twelve months. And that does include the dividend. That's better than the annualised return of 6% over half a decade, implying that the company is doing better recently. Given the share price momentum remains strong, it might be worth taking a closer look at the stock, lest you miss an opportunity. I find it very interesting to look at share price over the long term as a proxy for business performance. But to truly gain insight, we need to consider other information, too. For instance, we've identified 2 warning signs for Nedbank Group (1 is a bit unpleasant) that you should be aware of.
If you are like me, then you will not want to miss this free list of growing companies that insiders are buying.
Please note, the market returns quoted in this article reflect the market weighted average returns of stocks that currently trade on ZA exchanges.
If you're looking to trade Nedbank Group, open an account with the lowest-cost platform trusted by professionals, Interactive Brokers.
With clients in over 200 countries and territories, and access to 160 markets, IBKR lets you trade stocks, options, futures, forex, bonds and funds from a single integrated account.
Enjoy no hidden fees, no account minimums, and FX conversion rates as low as 0.03%, far better than what most brokers offer.
Sponsored ContentValuation is complex, but we're here to simplify it.
Discover if Nedbank Group might be undervalued or overvalued with our detailed analysis, featuring fair value estimates, potential risks, dividends, insider trades, and its financial condition.
Access Free AnalysisHave feedback on this article? Concerned about the content? Get in touch with us directly. Alternatively, email editorial-team (at) simplywallst.com.
This article by Simply Wall St is general in nature. We provide commentary based on historical data and analyst forecasts only using an unbiased methodology and our articles are not intended to be financial advice. It does not constitute a recommendation to buy or sell any stock, and does not take account of your objectives, or your financial situation. We aim to bring you long-term focused analysis driven by fundamental data. Note that our analysis may not factor in the latest price-sensitive company announcements or qualitative material. Simply Wall St has no position in any stocks mentioned.
About JSE:NED
Nedbank Group
Provides various wholesale and retail banking services in South Africa and internationally.
Adequate balance sheet average dividend payer.
Similar Companies
Market Insights

Community Narratives

