Advertisement
- United States
- /
- Electric Utilities
- /
- NYSE:NRG
Has NRG Run Too Far After 75% Surge and AI Data Center Expansion News?

Simply Wall St
Reviewed by Bailey Pemberton
If you’re looking at NRG Energy and thinking, “Is this the right time to buy, sell, or just hold tight?” you’re not alone. NRG’s stock has been on an absolute tear, with returns that would make even the most seasoned investors take notice. In the past five years, the stock has risen an eye-popping 470.8%. Even zooming in, NRG is up 76.5% over the last year and 75.3% year-to-date. The past month alone delivered a healthy 10.1% uptick, and while this last week’s 0.4% gain might seem modest, it speaks to the stock’s resilience as market watchers debate its next move.
Much of this powerful run traces back to the wider push toward energy transition and some company-specific changes that have led investors to reassess NRG’s risk and reward profile. While broader market trends helped, there is clearly something unique happening here, as NRG’s gains have far outpaced sector peers. But with rapid share price appreciation comes a question every investor must ask themselves: how much value is left, and what does current pricing really reflect?
When we ran NRG through a rigorous set of six valuation checks, it was flagged as undervalued in just two. That gives it a valuation score of 2, hinting there may be pockets of value, but not a compelling opportunity in every respect.
Soon, we will break down exactly what those valuation checks revealed and introduce one additional way of thinking about value that could shift how you look at NRG altogether.
NRG Energy scores just 2/6 on our valuation checks. See what other red flags we found in the full valuation breakdown.
Approach 1: NRG Energy Discounted Cash Flow (DCF) Analysis
The Discounted Cash Flow (DCF) model works by extrapolating a company’s expected future cash flows and discounting them back to their present-day value. This approach helps estimate what a business is truly worth today based on the cash it can generate in the years ahead.
For NRG Energy, the company’s latest reported Free Cash Flow stands at $1.65 billion. Analysts provide projections for up to five years, with estimates showing growth in annual cash flows. Simply Wall St’s model continues these projections through the next decade. By 2029, Free Cash Flow is anticipated to reach $4.24 billion, and the extrapolated outlook for 2035 sees annual cash flows as high as $6 billion. All figures are reported in US dollars.
Using the two-stage Free Cash Flow to Equity model, this analysis arrives at an estimated intrinsic value of $608.64 per share. With the DCF model indicating NRG shares are trading at a 73.3% discount to this estimated value, the implication is that the stock is significantly undervalued compared to its intrinsic worth derived from future cash flows.
Result: UNDERVALUED
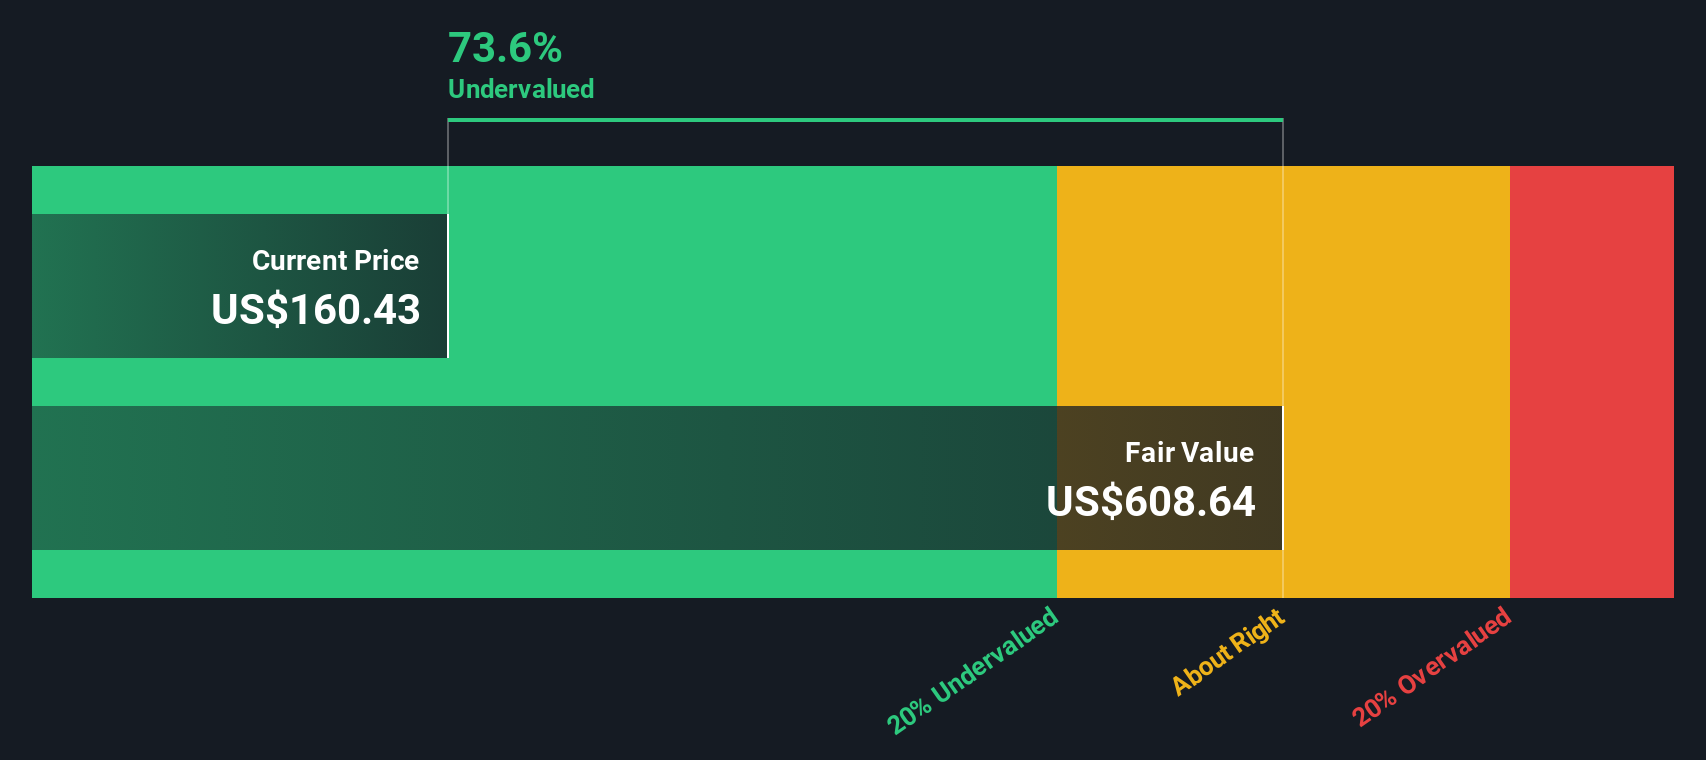
Our Discounted Cash Flow (DCF) analysis suggests NRG Energy is undervalued by 73.3%. Track this in your watchlist or portfolio, or discover more undervalued stocks.
Approach 2: NRG Energy Price vs Earnings
For companies like NRG Energy that are consistently profitable, the Price-to-Earnings (PE) ratio is widely regarded as a reliable way to gauge market valuation. The PE ratio tells investors how much they are paying for each dollar of company earnings, making it especially useful for evaluating established firms with steady profits.
It is important to remember that a company’s fair or normal PE ratio depends heavily on expected growth rates and risk levels. Businesses with high expected earnings growth or lower risk profiles tend to justify higher PE ratios, while slower growers or those with more uncertainty often trade at lower multiples.
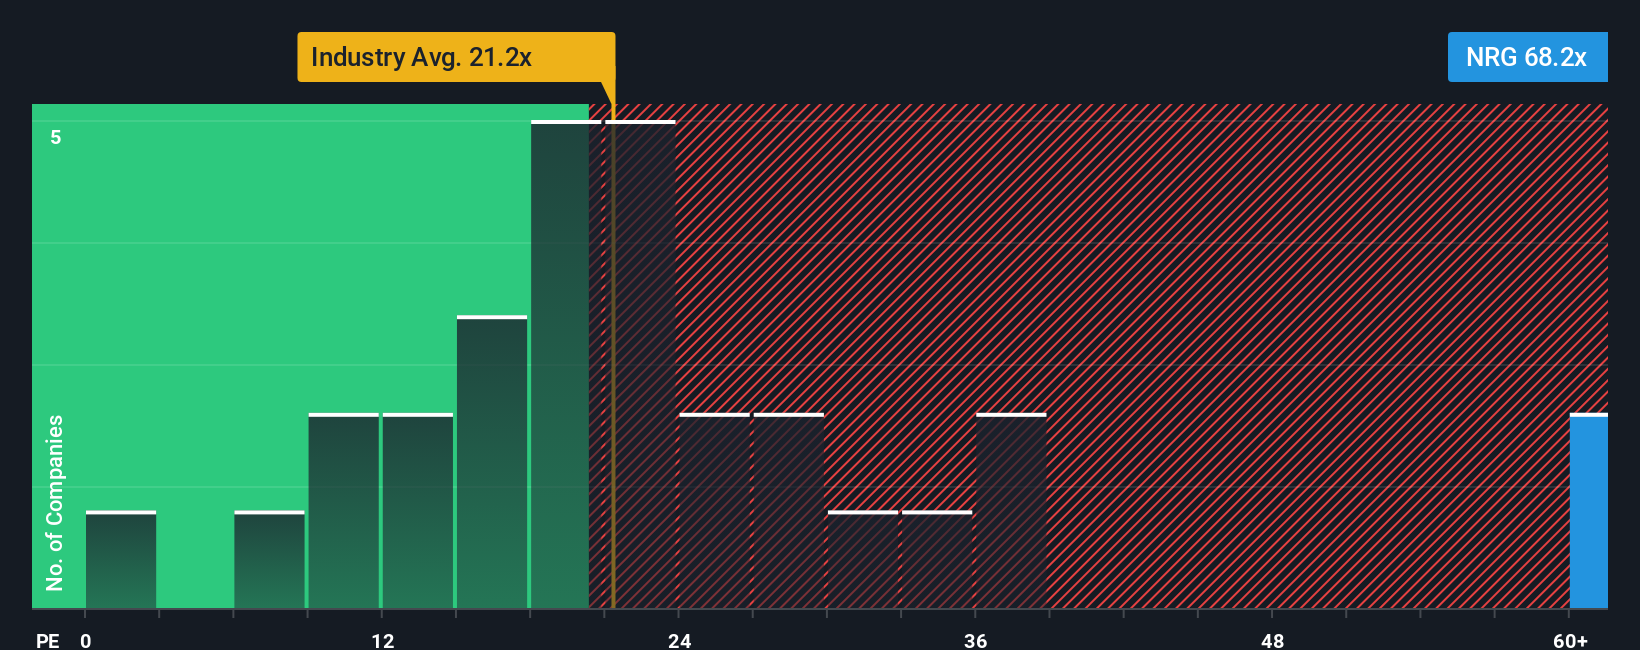
NRG Energy’s current PE ratio stands at 69.1x, which is significantly higher than the Electric Utilities industry average of 21.3x and the peer group average of 24.8x. At a glance, this might make NRG appear expensive relative to similar companies. However, Simply Wall St’s proprietary “Fair Ratio,” at 37.2x, is specifically calibrated to NRG’s own growth outlook, profit margins, industry context, market cap, and business risks.
Unlike basic industry or peer group comparisons, the Fair Ratio reflects a more complete picture by weighing these individualized factors. For NRG Energy, this number provides a better sense of what the market should be paying given the company’s uniqueness.
With NRG’s actual PE ratio (69.1x) significantly above its Fair Ratio (37.2x), the stock appears overvalued based on earnings fundamentals.
Result: OVERVALUED
PE ratios tell one story, but what if the real opportunity lies elsewhere? Discover companies where insiders are betting big on explosive growth.
Upgrade Your Decision Making: Choose your NRG Energy Narrative
Earlier we mentioned that there is an even better way to understand valuation. Let’s introduce you to Narratives. A Narrative connects your personal story or perspective on a company’s future with the underlying numbers, such as fair value and forecasts for revenue, earnings, and margins. Instead of just crunching numbers, Narratives let you express why you believe NRG Energy is undervalued or overpriced by linking your view of the company’s business trends and risks to a clear financial forecast.
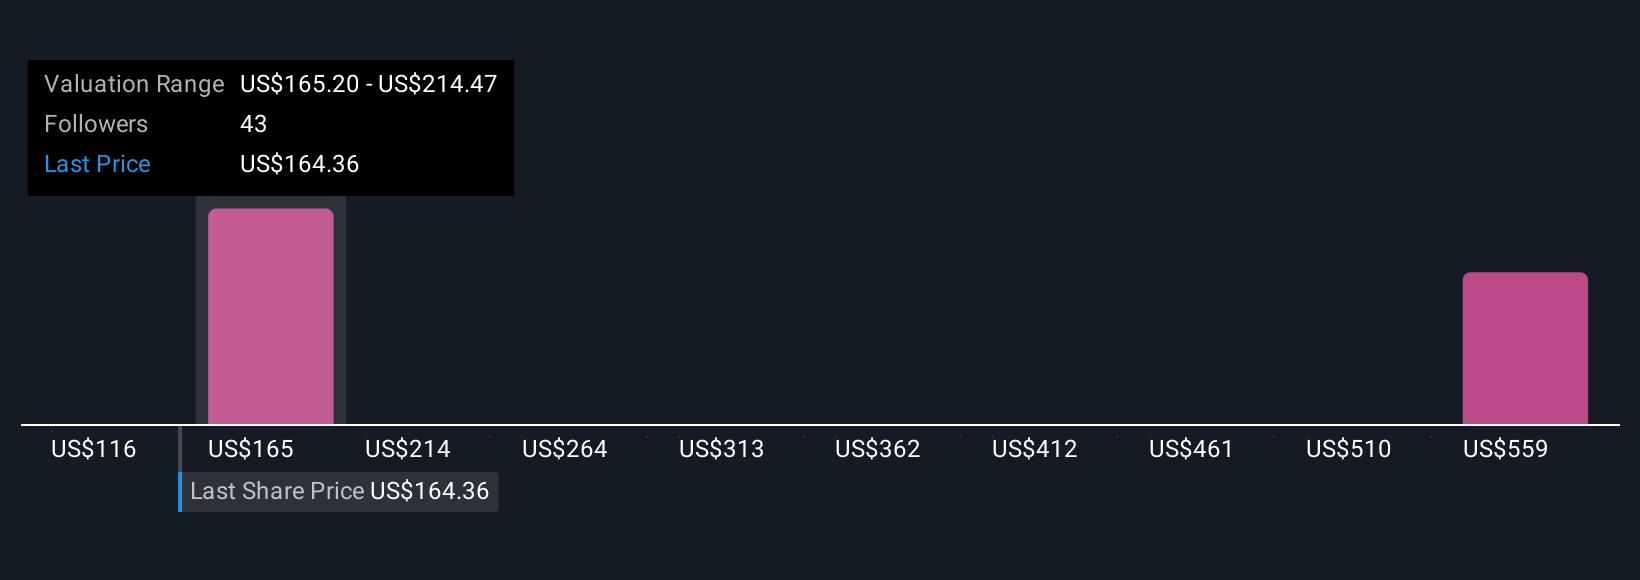
Millions of investors are already using Narratives on Simply Wall St’s Community page as a simple yet powerful tool to put their own stamp on each decision. Narratives help you decide when to buy or sell by comparing your calculated Fair Value to the current market Price, and they automatically update if new news or results come in, so your thesis stays current. For example, some investors believe NRG will thrive as electrification and data center demand grow, setting price targets as high as $203.00. Others are more cautious, highlighting risks and setting targets as low as $92.00. Narratives put you in the driver’s seat, turning the process of stock analysis into a dynamic, personal experience.
Do you think there's more to the story for NRG Energy? Create your own Narrative to let the Community know!
This article by Simply Wall St is general in nature. We provide commentary based on historical data and analyst forecasts only using an unbiased methodology and our articles are not intended to be financial advice. It does not constitute a recommendation to buy or sell any stock, and does not take account of your objectives, or your financial situation. We aim to bring you long-term focused analysis driven by fundamental data. Note that our analysis may not factor in the latest price-sensitive company announcements or qualitative material. Simply Wall St has no position in any stocks mentioned.
Valuation is complex, but we're here to simplify it.
Discover if NRG Energy might be undervalued or overvalued with our detailed analysis, featuring fair value estimates, potential risks, dividends, insider trades, and its financial condition.
Access Free AnalysisHave feedback on this article? Concerned about the content? Get in touch with us directly. Alternatively, email editorial-team@simplywallst.com
About NYSE:NRG
NRG Energy
Operates as an energy and home services company in the United States and Canada.
Average dividend payer with moderate growth potential.
Similar Companies
Market Insights

Advertisement
Community Narratives
A formidable player in AI and enterprise computing.
Fair Value US$210.00|0.7% overvalued
CO
Community Contributor
IREN's Bold Moves in Sustainable Bitcoin Mining & AI Data Centers
Fair Value US$72.52|14.9% undervalued
BL
Community Contributor
Cooling the Champions: The Aussie Tech Behind F1's Victories
Fair Value AU$12.40|38.1% undervalued
TR
Community Contributor