- United States
- /
- Electric Utilities
- /
- NYSE:DUK
Duke Energy's (NYSE:DUK) investors will be pleased with their respectable 32% return over the last year


These days it's easy to simply buy an index fund, and your returns should (roughly) match the market. But you can significantly boost your returns by picking above-average stocks. To wit, the Duke Energy Corporation (NYSE:DUK) share price is 27% higher than it was a year ago, much better than the market return of around 20% (not including dividends) in the same period. That's a solid performance by our standards! Having said that, the longer term returns aren't so impressive, with stock gaining just 15% in three years.
Now it's worth having a look at the company's fundamentals too, because that will help us determine if the long term shareholder return has matched the performance of the underlying business.
View our latest analysis for Duke Energy
While the efficient markets hypothesis continues to be taught by some, it has been proven that markets are over-reactive dynamic systems, and investors are not always rational. One flawed but reasonable way to assess how sentiment around a company has changed is to compare the earnings per share (EPS) with the share price.
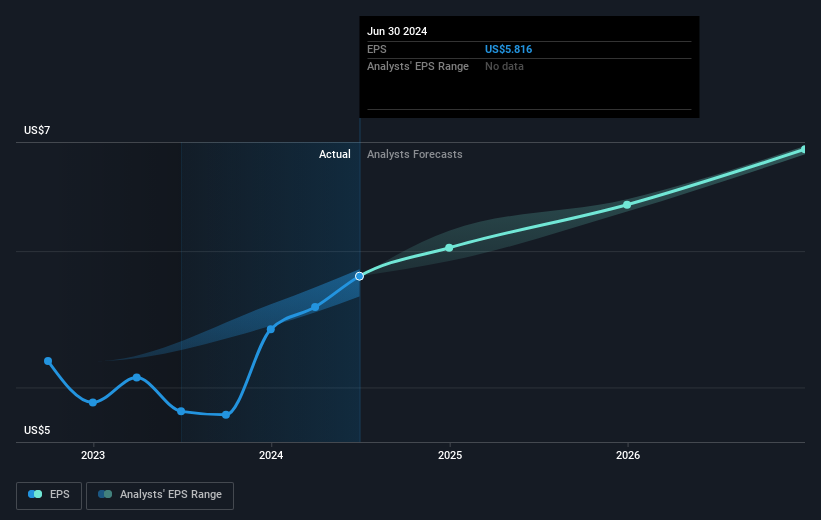
During the last year Duke Energy grew its earnings per share (EPS) by 21%. This EPS growth is significantly lower than the 27% increase in the share price. This indicates that the market is now more optimistic about the stock.
You can see how EPS has changed over time in the image below (click on the chart to see the exact values).
We know that Duke Energy has improved its bottom line lately, but is it going to grow revenue? This free report showing analyst revenue forecasts should help you figure out if the EPS growth can be sustained.
What About Dividends?
As well as measuring the share price return, investors should also consider the total shareholder return (TSR). Whereas the share price return only reflects the change in the share price, the TSR includes the value of dividends (assuming they were reinvested) and the benefit of any discounted capital raising or spin-off. So for companies that pay a generous dividend, the TSR is often a lot higher than the share price return. In the case of Duke Energy, it has a TSR of 32% for the last 1 year. That exceeds its share price return that we previously mentioned. The dividends paid by the company have thusly boosted the total shareholder return.
A Different Perspective
We're pleased to report that Duke Energy shareholders have received a total shareholder return of 32% over one year. That's including the dividend. That gain is better than the annual TSR over five years, which is 9%. Therefore it seems like sentiment around the company has been positive lately. Someone with an optimistic perspective could view the recent improvement in TSR as indicating that the business itself is getting better with time. It's always interesting to track share price performance over the longer term. But to understand Duke Energy better, we need to consider many other factors. Consider for instance, the ever-present spectre of investment risk. We've identified 3 warning signs with Duke Energy (at least 1 which can't be ignored) , and understanding them should be part of your investment process.
But note: Duke Energy may not be the best stock to buy. So take a peek at this free list of interesting companies with past earnings growth (and further growth forecast).
Please note, the market returns quoted in this article reflect the market weighted average returns of stocks that currently trade on American exchanges.
New: Manage All Your Stock Portfolios in One Place
We've created the ultimate portfolio companion for stock investors, and it's free.
• Connect an unlimited number of Portfolios and see your total in one currency
• Be alerted to new Warning Signs or Risks via email or mobile
• Track the Fair Value of your stocks
Have feedback on this article? Concerned about the content? Get in touch with us directly. Alternatively, email editorial-team (at) simplywallst.com.
This article by Simply Wall St is general in nature. We provide commentary based on historical data and analyst forecasts only using an unbiased methodology and our articles are not intended to be financial advice. It does not constitute a recommendation to buy or sell any stock, and does not take account of your objectives, or your financial situation. We aim to bring you long-term focused analysis driven by fundamental data. Note that our analysis may not factor in the latest price-sensitive company announcements or qualitative material. Simply Wall St has no position in any stocks mentioned.
About NYSE:DUK
Duke Energy
Through its subsidiaries, operates as an energy company in the United States.
Average dividend payer with acceptable track record.

