
Advertisement
- United States
- /
- Marine and Shipping
- /
- NasdaqGS:SBLK
Is There An Opportunity With Star Bulk Carriers Corp.'s (NASDAQ:SBLK) 50% Undervaluation?

Key Insights
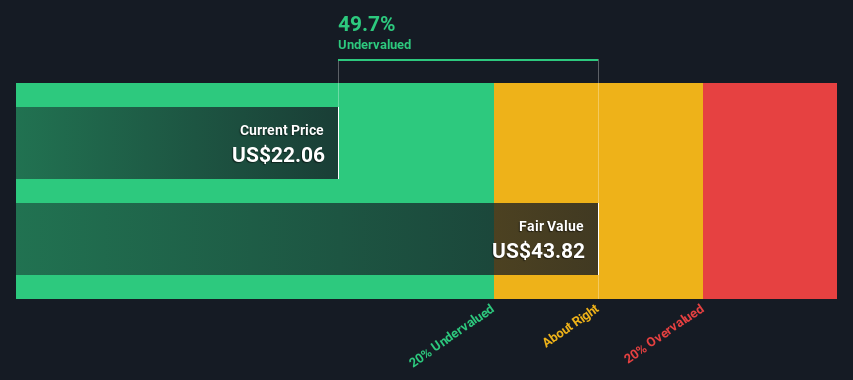
- The projected fair value for Star Bulk Carriers is US$43.82 based on 2 Stage Free Cash Flow to Equity
- Star Bulk Carriers is estimated to be 50% undervalued based on current share price of US$22.06
- Analyst price target for SBLK is US$22.57 which is 48% below our fair value estimate
Today we'll do a simple run through of a valuation method used to estimate the attractiveness of Star Bulk Carriers Corp. (NASDAQ:SBLK) as an investment opportunity by taking the forecast future cash flows of the company and discounting them back to today's value. This will be done using the Discounted Cash Flow (DCF) model. Believe it or not, it's not too difficult to follow, as you'll see from our example!
We would caution that there are many ways of valuing a company and, like the DCF, each technique has advantages and disadvantages in certain scenarios. For those who are keen learners of equity analysis, the Simply Wall St analysis model here may be something of interest to you.
View our latest analysis for Star Bulk Carriers
Step By Step Through The Calculation
We're using the 2-stage growth model, which simply means we take in account two stages of company's growth. In the initial period the company may have a higher growth rate and the second stage is usually assumed to have a stable growth rate. To begin with, we have to get estimates of the next ten years of cash flows. Where possible we use analyst estimates, but when these aren't available we extrapolate the previous free cash flow (FCF) from the last estimate or reported value. We assume companies with shrinking free cash flow will slow their rate of shrinkage, and that companies with growing free cash flow will see their growth rate slow, over this period. We do this to reflect that growth tends to slow more in the early years than it does in later years.
Generally we assume that a dollar today is more valuable than a dollar in the future, so we need to discount the sum of these future cash flows to arrive at a present value estimate:
10-year free cash flow (FCF) forecast
| 2024 | 2025 | 2026 | 2027 | 2028 | 2029 | 2030 | 2031 | 2032 | 2033 | |
| Levered FCF ($, Millions) | US$392.1m | US$416.3m | US$435.2m | US$451.9m | US$467.0m | US$481.1m | US$494.4m | US$507.3m | US$519.9m | US$532.5m |
| Growth Rate Estimate Source | Analyst x3 | Analyst x3 | Est @ 4.53% | Est @ 3.84% | Est @ 3.35% | Est @ 3.01% | Est @ 2.77% | Est @ 2.61% | Est @ 2.49% | Est @ 2.41% |
| Present Value ($, Millions) Discounted @ 14% | US$345 | US$321 | US$295 | US$269 | US$245 | US$221 | US$200 | US$180 | US$162 | US$146 |
("Est" = FCF growth rate estimated by Simply Wall St)
Present Value of 10-year Cash Flow (PVCF) = US$2.4b
We now need to calculate the Terminal Value, which accounts for all the future cash flows after this ten year period. The Gordon Growth formula is used to calculate Terminal Value at a future annual growth rate equal to the 5-year average of the 10-year government bond yield of 2.2%. We discount the terminal cash flows to today's value at a cost of equity of 14%.
Terminal Value (TV)= FCF2033 × (1 + g) ÷ (r – g) = US$532m× (1 + 2.2%) ÷ (14%– 2.2%) = US$4.7b
Present Value of Terminal Value (PVTV)= TV / (1 + r)10= US$4.7b÷ ( 1 + 14%)10= US$1.3b
The total value is the sum of cash flows for the next ten years plus the discounted terminal value, which results in the Total Equity Value, which in this case is US$3.7b. To get the intrinsic value per share, we divide this by the total number of shares outstanding. Relative to the current share price of US$22.1, the company appears quite undervalued at a 50% discount to where the stock price trades currently. The assumptions in any calculation have a big impact on the valuation, so it is better to view this as a rough estimate, not precise down to the last cent.
The Assumptions
We would point out that the most important inputs to a discounted cash flow are the discount rate and of course the actual cash flows. If you don't agree with these result, have a go at the calculation yourself and play with the assumptions. The DCF also does not consider the possible cyclicality of an industry, or a company's future capital requirements, so it does not give a full picture of a company's potential performance. Given that we are looking at Star Bulk Carriers as potential shareholders, the cost of equity is used as the discount rate, rather than the cost of capital (or weighted average cost of capital, WACC) which accounts for debt. In this calculation we've used 14%, which is based on a levered beta of 1.107. Beta is a measure of a stock's volatility, compared to the market as a whole. We get our beta from the industry average beta of globally comparable companies, with an imposed limit between 0.8 and 2.0, which is a reasonable range for a stable business.
SWOT Analysis for Star Bulk Carriers
Strength
- Debt is not viewed as a risk.
- Dividend is in the top 25% of dividend payers in the market.
Weakness
- Earnings declined over the past year.
Opportunity
- Annual earnings are forecast to grow faster than the American market.
- Good value based on P/E ratio and estimated fair value.
Threat
- Dividends are not covered by cash flow.
- Annual revenue is forecast to grow slower than the American market.
Next Steps:
Valuation is only one side of the coin in terms of building your investment thesis, and it ideally won't be the sole piece of analysis you scrutinize for a company. It's not possible to obtain a foolproof valuation with a DCF model. Rather it should be seen as a guide to "what assumptions need to be true for this stock to be under/overvalued?" For instance, if the terminal value growth rate is adjusted slightly, it can dramatically alter the overall result. Can we work out why the company is trading at a discount to intrinsic value? For Star Bulk Carriers, we've compiled three important factors you should consider:
- Risks: Consider for instance, the ever-present spectre of investment risk. We've identified 2 warning signs with Star Bulk Carriers , and understanding these should be part of your investment process.
- Future Earnings: How does SBLK's growth rate compare to its peers and the wider market? Dig deeper into the analyst consensus number for the upcoming years by interacting with our free analyst growth expectation chart.
- Other High Quality Alternatives: Do you like a good all-rounder? Explore our interactive list of high quality stocks to get an idea of what else is out there you may be missing!
PS. The Simply Wall St app conducts a discounted cash flow valuation for every stock on the NASDAQGS every day. If you want to find the calculation for other stocks just search here.
New: Manage All Your Stock Portfolios in One Place
We've created the ultimate portfolio companion for stock investors, and it's free.
• Connect an unlimited number of Portfolios and see your total in one currency
• Be alerted to new Warning Signs or Risks via email or mobile
• Track the Fair Value of your stocks
Have feedback on this article? Concerned about the content? Get in touch with us directly. Alternatively, email editorial-team (at) simplywallst.com.
This article by Simply Wall St is general in nature. We provide commentary based on historical data and analyst forecasts only using an unbiased methodology and our articles are not intended to be financial advice. It does not constitute a recommendation to buy or sell any stock, and does not take account of your objectives, or your financial situation. We aim to bring you long-term focused analysis driven by fundamental data. Note that our analysis may not factor in the latest price-sensitive company announcements or qualitative material. Simply Wall St has no position in any stocks mentioned.
About NasdaqGS:SBLK
Star Bulk Carriers
A shipping company, engages in the ocean transportation of dry bulk cargoes through the ownership and operation of dry bulk carrier vessels worldwide.
Excellent balance sheet and fair value.
Similar Companies
Market Insights


Advertisement
Community Narratives
Pole position to benefit from GENIUS Act
Fair Value US$233.04|58.8% undervalued
CH
Community Contributor
IREN will transform from bitcoin miner to leader in AI infrastructure
Fair Value US$21.48|17.5% undervalued
KA
Community Contributor
Behind the Assay: XRF Scientific’s Role in Modern Mining Economics
Fair Value AU$2.10|2.4% undervalued
RO
Community Contributor