
Advertisement
- United States
- /
- Logistics
- /
- NasdaqGS:CHRW
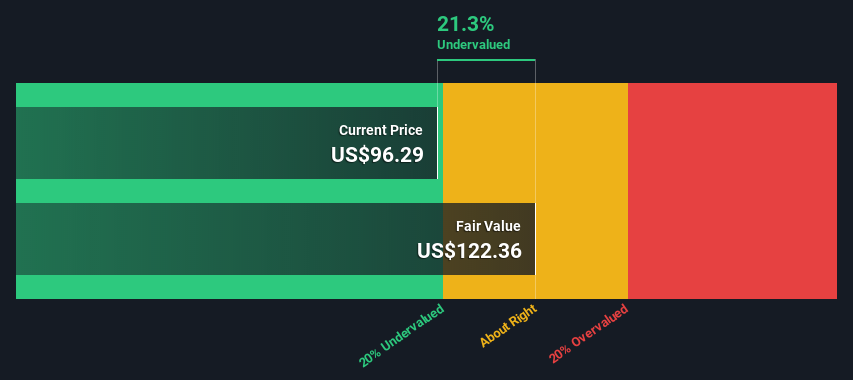
Is There An Opportunity With C.H. Robinson Worldwide, Inc.'s (NASDAQ:CHRW) 21% Undervaluation?

Does the October share price for C.H. Robinson Worldwide, Inc. (NASDAQ:CHRW) reflect what it's really worth? Today, we will estimate the stock's intrinsic value by taking the expected future cash flows and discounting them to today's value. One way to achieve this is by employing the Discounted Cash Flow (DCF) model. Before you think you won't be able to understand it, just read on! It's actually much less complex than you'd imagine.
Companies can be valued in a lot of ways, so we would point out that a DCF is not perfect for every situation. If you still have some burning questions about this type of valuation, take a look at the Simply Wall St analysis model.
Check out the opportunities and risks within the US Logistics industry.
Step By Step Through The Calculation
We are going to use a two-stage DCF model, which, as the name states, takes into account two stages of growth. The first stage is generally a higher growth period which levels off heading towards the terminal value, captured in the second 'steady growth' period. To begin with, we have to get estimates of the next ten years of cash flows. Where possible we use analyst estimates, but when these aren't available we extrapolate the previous free cash flow (FCF) from the last estimate or reported value. We assume companies with shrinking free cash flow will slow their rate of shrinkage, and that companies with growing free cash flow will see their growth rate slow, over this period. We do this to reflect that growth tends to slow more in the early years than it does in later years.
Generally we assume that a dollar today is more valuable than a dollar in the future, so we need to discount the sum of these future cash flows to arrive at a present value estimate:
10-year free cash flow (FCF) forecast
| 2023 | 2024 | 2025 | 2026 | 2027 | 2028 | 2029 | 2030 | 2031 | 2032 | |
| Levered FCF ($, Millions) | US$1.09b | US$715.9m | US$839.9m | US$822.2m | US$815.8m | US$816.2m | US$821.3m | US$829.8m | US$840.7m | US$853.4m |
| Growth Rate Estimate Source | Analyst x6 | Analyst x3 | Analyst x2 | Analyst x2 | Est @ -0.78% | Est @ 0.05% | Est @ 0.63% | Est @ 1.03% | Est @ 1.32% | Est @ 1.52% |
| Present Value ($, Millions) Discounted @ 6.9% | US$1.0k | US$627 | US$688 | US$630 | US$585 | US$548 | US$516 | US$488 | US$462 | US$439 |
("Est" = FCF growth rate estimated by Simply Wall St)
Present Value of 10-year Cash Flow (PVCF) = US$6.0b
The second stage is also known as Terminal Value, this is the business's cash flow after the first stage. For a number of reasons a very conservative growth rate is used that cannot exceed that of a country's GDP growth. In this case we have used the 5-year average of the 10-year government bond yield (2.0%) to estimate future growth. In the same way as with the 10-year 'growth' period, we discount future cash flows to today's value, using a cost of equity of 6.9%.
Terminal Value (TV)= FCF2032 × (1 + g) ÷ (r – g) = US$853m× (1 + 2.0%) ÷ (6.9%– 2.0%) = US$18b
Present Value of Terminal Value (PVTV)= TV / (1 + r)10= US$18b÷ ( 1 + 6.9%)10= US$9.2b
The total value, or equity value, is then the sum of the present value of the future cash flows, which in this case is US$15b. To get the intrinsic value per share, we divide this by the total number of shares outstanding. Compared to the current share price of US$96.3, the company appears a touch undervalued at a 21% discount to where the stock price trades currently. The assumptions in any calculation have a big impact on the valuation, so it is better to view this as a rough estimate, not precise down to the last cent.
The Assumptions
The calculation above is very dependent on two assumptions. The first is the discount rate and the other is the cash flows. Part of investing is coming up with your own evaluation of a company's future performance, so try the calculation yourself and check your own assumptions. The DCF also does not consider the possible cyclicality of an industry, or a company's future capital requirements, so it does not give a full picture of a company's potential performance. Given that we are looking at C.H. Robinson Worldwide as potential shareholders, the cost of equity is used as the discount rate, rather than the cost of capital (or weighted average cost of capital, WACC) which accounts for debt. In this calculation we've used 6.9%, which is based on a levered beta of 1.045. Beta is a measure of a stock's volatility, compared to the market as a whole. We get our beta from the industry average beta of globally comparable companies, with an imposed limit between 0.8 and 2.0, which is a reasonable range for a stable business.
SWOT Analysis for C.H. Robinson Worldwide
Strength
- Earnings growth over the past year exceeded its 5-year average.
- Debt is well covered by earnings.
Weakness
- Earnings growth over the past year underperformed the Logistics industry.
- Dividend is low compared to the top 25% of dividend payers in the Logistics market.
Opportunity
- Trading below our estimate of fair value by more than 20%.
Threat
- Debt is not well covered by operating cash flow.
- Dividends are not covered by cash flow.
- Annual earnings are forecast to decline for the next 3 years.
Next Steps:
Valuation is only one side of the coin in terms of building your investment thesis, and it shouldn't be the only metric you look at when researching a company. The DCF model is not a perfect stock valuation tool. Instead the best use for a DCF model is to test certain assumptions and theories to see if they would lead to the company being undervalued or overvalued. For instance, if the terminal value growth rate is adjusted slightly, it can dramatically alter the overall result. Why is the intrinsic value higher than the current share price? For C.H. Robinson Worldwide, we've put together three additional elements you should assess:
- Risks: For instance, we've identified 5 warning signs for C.H. Robinson Worldwide (3 are significant) you should be aware of.
- Future Earnings: How does CHRW's growth rate compare to its peers and the wider market? Dig deeper into the analyst consensus number for the upcoming years by interacting with our free analyst growth expectation chart.
- Other High Quality Alternatives: Do you like a good all-rounder? Explore our interactive list of high quality stocks to get an idea of what else is out there you may be missing!
PS. Simply Wall St updates its DCF calculation for every American stock every day, so if you want to find the intrinsic value of any other stock just search here.
New: AI Stock Screener & Alerts
Our new AI Stock Screener scans the market every day to uncover opportunities.
• Dividend Powerhouses (3%+ Yield)
• Undervalued Small Caps with Insider Buying
• High growth Tech and AI Companies
Or build your own from over 50 metrics.
Have feedback on this article? Concerned about the content? Get in touch with us directly. Alternatively, email editorial-team (at) simplywallst.com.
This article by Simply Wall St is general in nature. We provide commentary based on historical data and analyst forecasts only using an unbiased methodology and our articles are not intended to be financial advice. It does not constitute a recommendation to buy or sell any stock, and does not take account of your objectives, or your financial situation. We aim to bring you long-term focused analysis driven by fundamental data. Note that our analysis may not factor in the latest price-sensitive company announcements or qualitative material. Simply Wall St has no position in any stocks mentioned.
About NasdaqGS:CHRW
C.H. Robinson Worldwide
Provides freight transportation and related logistics and supply chain services in the United States and internationally.
Solid track record with excellent balance sheet and pays a dividend.
Market Insights

Advertisement
Community Narratives
Groundbreaking therapies that could change the treatment landscape for PTSD, fibromyalgia, MS & Alzheimer’s
Fair Value US$6.20|86.9% undervalued
CM
Community Contributor
DigitalOcean Will Grow 14% by Embracing AI with Paperspace Acquisition
Fair Value US$50.00|41.7% undervalued
NE
Community Contributor
Viant Technology: A Rising AdTech Challenger in the AI-Powered CTV Market
Fair Value US$38.61|63.2% undervalued
BL
Community Contributor
Volvo will Accelerate Forward into Electric and Autonomous Leadership in Five Years
Fair Value SEK 438.80|39.7% undervalued
UN
Community Contributor