Advertisement
- United States
- /
- Airlines
- /
- NasdaqGS:AAL
Is There Opportunity in American Airlines as Shares Rebound 4% After Steep 2025 Drop?

Simply Wall St
Reviewed by Bailey Pemberton
If you have American Airlines Group on your watchlist, you are likely weighing what comes next for this prominent airline stock. After a rocky 30.4% drop so far this year, the share price recently managed to bounce 4.0% in the last week, sparking a fresh round of debate among investors. Has the worst passed, or is there still turbulence ahead?
It is not just about the latest moves, either. Over the past year, the stock is up a modest 2.6%, but long-term holders are still in the red, with five-year returns negative at -8.4%. Swings like this reflect changing risk perceptions, such as shifting travel demand, competitive pressures, and the impact of rising fuel costs. All of these factors have shaped how the market values airlines now compared to a few years ago. Bigger-picture moves in the industry, such as the ongoing recovery of international routes and recent talk of industry consolidation, are also filtering into valuations.
So, is American Airlines Group undervalued at its current price? According to a valuation score that adds a point for every undervaluation check out of six, American scores a 4, suggesting real potential for value if you dig beneath the surface. In the next section, we will break down how this score was reached, laying out different valuation methods and what they reveal. Also, we will look at a powerful way to put all these numbers into perspective as you decide your next steps.
Why American Airlines Group is lagging behind its peers
Approach 1: American Airlines Group Discounted Cash Flow (DCF) Analysis
The Discounted Cash Flow (DCF) model estimates what a business is worth today by projecting its future cash flows and then discounting them back to their present value. This method anchors the valuation in how much cash the company is expected to actually generate over time, adjusted for the time value of money.
For American Airlines Group, the current Free Cash Flow (FCF) stands at $1.48 billion. Looking ahead, analysts provide annual estimates for several years. For example, projected FCF for 2028 is $1.58 billion. Beyond analysts’ outlook, Simply Wall St extrapolates further, with estimates rising as high as $5.27 billion by 2035. All cash flows are reported in US dollars.
Based on these modeled projections and using the 2 Stage Free Cash Flow to Equity approach, the DCF model calculates an intrinsic share value of $48.95. This suggests the stock is trading at a compelling 75.8% discount to its estimated fair value at today’s price.
Result: UNDERVALUED
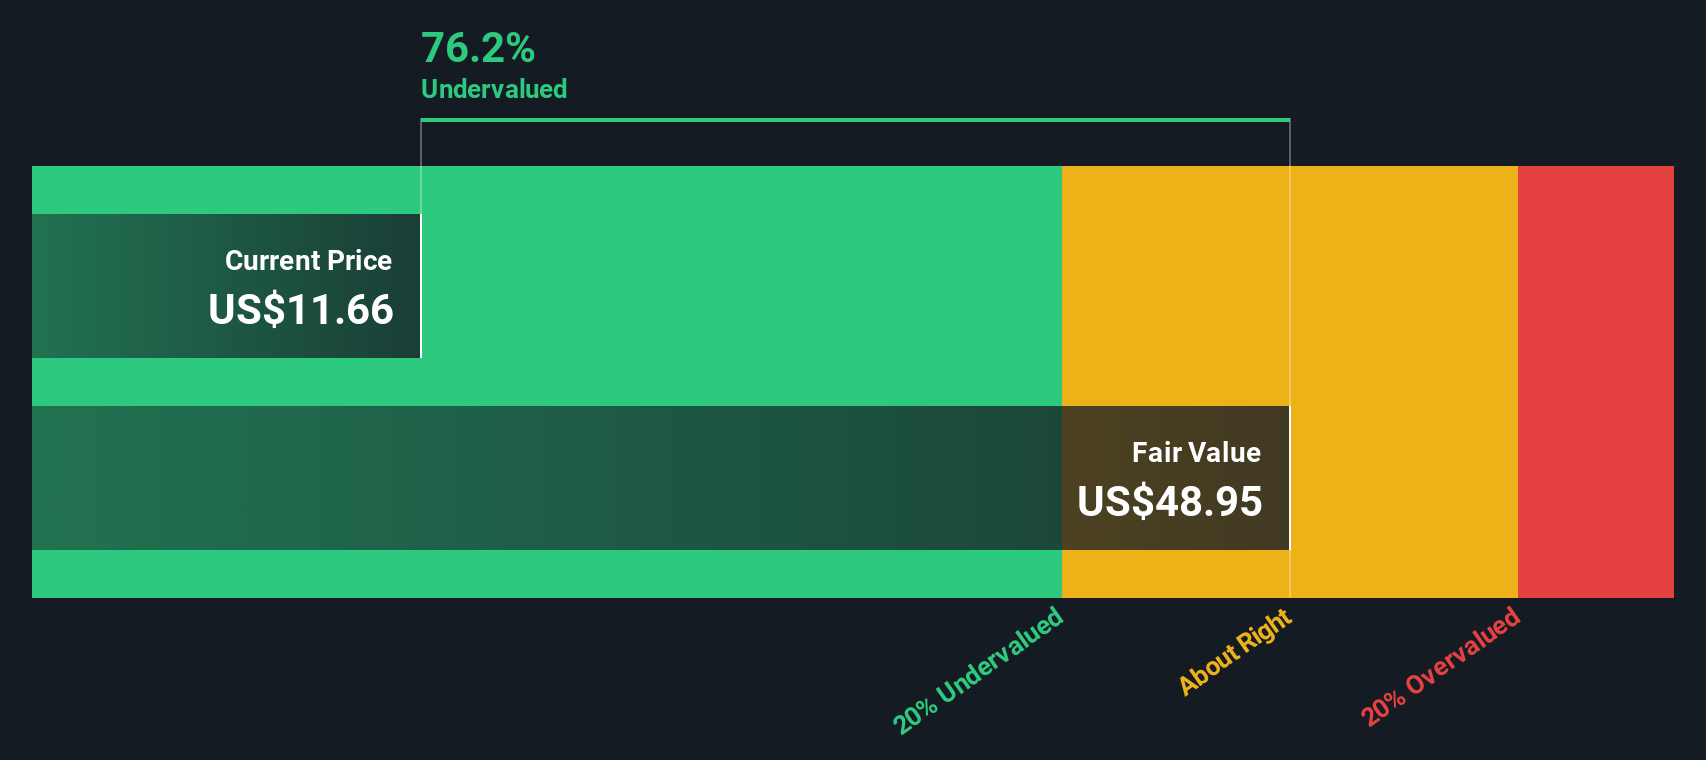
Our Discounted Cash Flow (DCF) analysis suggests American Airlines Group is undervalued by 75.8%. Track this in your watchlist or portfolio, or discover more undervalued stocks.
Approach 2: American Airlines Group Price vs Earnings
The Price-to-Earnings (PE) ratio is a widely used valuation tool for profitable companies, as it directly relates the stock price to the company’s underlying earnings. It helps investors gauge whether a stock is trading at a reasonable price given how much profit the business is currently generating and expected to generate in the future.
When evaluating a "fair" PE ratio, context matters. Companies with stronger growth prospects, higher profit margins, or lower risk profiles are typically assigned higher PE ratios by the market, reflecting greater optimism about their future earnings. Conversely, if risks are elevated or earnings growth is expected to slow, the market may discount the PE multiple accordingly.
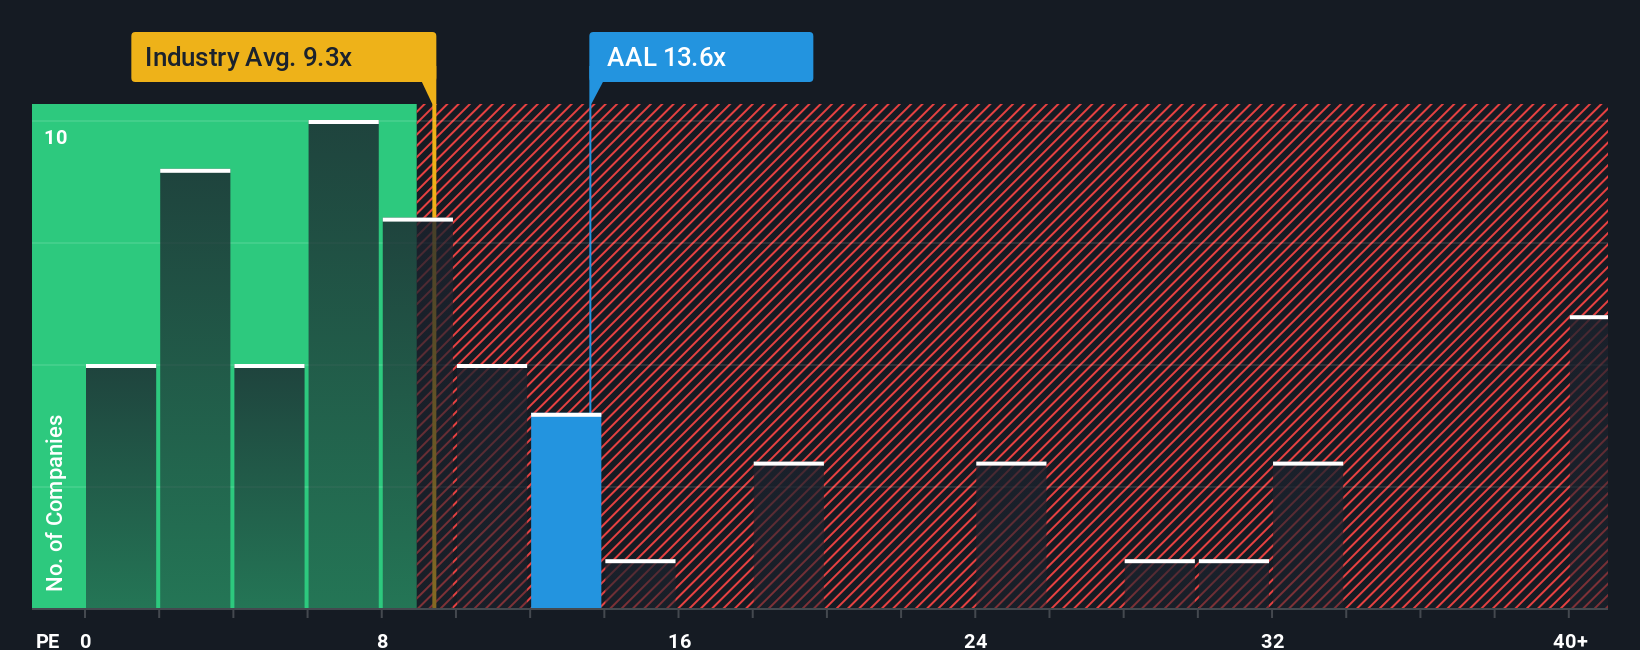
American Airlines Group currently trades at a PE ratio of 13.77x. For comparison, the industry average is 9.29x, while the average among its direct peers sits at 19.82x. On the surface, this places American partway between its sector and peers. However, Simply Wall St's proprietary “Fair Ratio” offers a more tailored perspective. Calculated at 23.93x, this figure incorporates several company-specific factors including earnings growth, profit margins, market capitalization, and risk profile. This is something broad industry and peer averages can miss.
By comparing American Airlines Group’s actual PE ratio of 13.77x to its Fair Ratio of 23.93x, the stock appears to trade notably below what would be expected if all positive or negative company-specific attributes were priced in. This implies the shares are currently undervalued from an earnings perspective.
Result: UNDERVALUED
PE ratios tell one story, but what if the real opportunity lies elsewhere? Discover companies where insiders are betting big on explosive growth.
Upgrade Your Decision Making: Choose your American Airlines Group Narrative
Earlier we mentioned that there's an even better way to understand valuation, so let's introduce you to Narratives. A Narrative puts your perspective front and center. It is a story you create about a company’s future, linking the numbers (your own estimates of revenue, profit margins, and fair value) with a clear explanation of what you expect to happen and why. Rather than simply relying on ratios or consensus price targets, Narratives help you connect American Airlines Group’s business trends or catalysts directly to a financial outlook, resulting in your personal fair value for the stock.
Narratives are easy and accessible. On Simply Wall St’s Community page, millions of investors share and compare their stories in real time. Narratives let you make buy or sell decisions confidently by showing how your fair value stacks up against the current share price, and because they update dynamically when big news or earnings come in, your view always stays fresh and relevant.
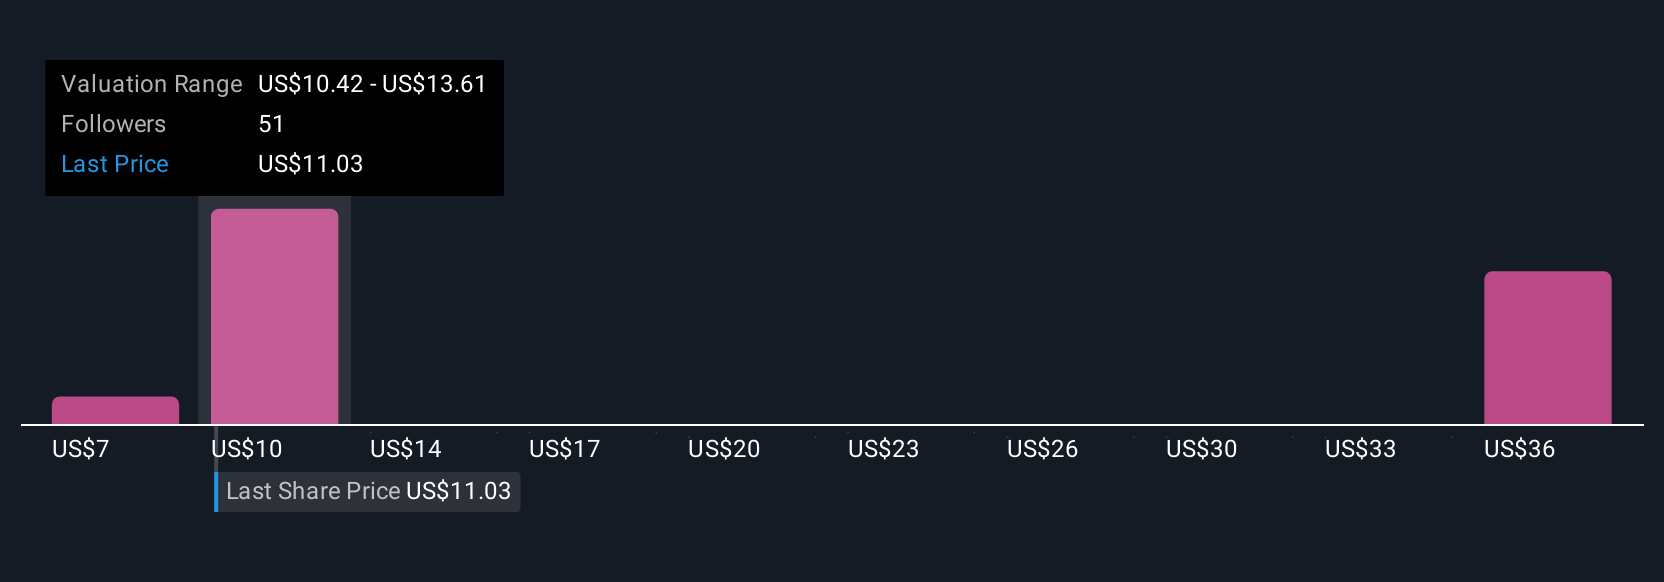
For American Airlines Group, for example, Narratives in the Community range from a lowest fair value of $10.61, highlighting concerns over debt and margin pressure, to a high of $13.88 backed by optimism about premium offerings, loyalty program growth, and operational upgrades. This shows just how different conclusions can be even using the same facts.
For American Airlines Group, we simplify the process for you with previews of two leading American Airlines Group Narratives:
- 🐂 American Airlines Group Bull Case
Fair Value: $13.88
26% undervalued compared to the current price
Revenue Growth: 4.4%
- Domestic recovery, premium product upgrades, and loyalty program gains are expected to drive revenue and margin improvement.
- Efficiency gained from new aircraft, expanded partnerships, and digital enhancements supports higher long-term earnings and free cash flow.
- Risks remain from high debt as well as labor and operational costs, but analysts overall see the company as fairly priced with potential upside if catalysts occur.
- 🐻 American Airlines Group Bear Case
Fair Value: $10.61
12% overvalued compared to the current price
Revenue Growth: 2.5%
- American Airlines’ highly leveraged and negative equity balance sheet leaves it more exposed than peers to financial shocks.
- Competitive pressures and recent warnings over travel demand point to margin risk and reduced investment appeal.
- Profitability depends on executing premium product strategies and continued easy refinancing, which remain uncertain in the current environment.
Do you think there's more to the story for American Airlines Group? Create your own Narrative to let the Community know!
This article by Simply Wall St is general in nature. We provide commentary based on historical data and analyst forecasts only using an unbiased methodology and our articles are not intended to be financial advice. It does not constitute a recommendation to buy or sell any stock, and does not take account of your objectives, or your financial situation. We aim to bring you long-term focused analysis driven by fundamental data. Note that our analysis may not factor in the latest price-sensitive company announcements or qualitative material. Simply Wall St has no position in any stocks mentioned.
New: Manage All Your Stock Portfolios in One Place
We've created the ultimate portfolio companion for stock investors, and it's free.
• Connect an unlimited number of Portfolios and see your total in one currency
• Be alerted to new Warning Signs or Risks via email or mobile
• Track the Fair Value of your stocks
Have feedback on this article? Concerned about the content? Get in touch with us directly. Alternatively, email editorial-team@simplywallst.com
About NasdaqGS:AAL
American Airlines Group
Through its subsidiaries, operates as a network air carrier in the United States, Latin America, Atlantic, and Pacific.
Good value with reasonable growth potential.
Similar Companies
Market Insights

Advertisement
Community Narratives
The Next Phase of Energy Storage: How NeoVolta Is Tackling America’s Power Crunch
Fair Value US$7.50|30.4% undervalued
MA
Community Contributor
A formidable player in AI and enterprise computing.
Fair Value US$210.00|3.0% undervalued
CO
Community Contributor
IREN's Bold Moves in Sustainable Bitcoin Mining & AI Data Centers
Fair Value US$72.52|20.4% undervalued
BL
Community Contributor
Cooling the Champions: The Aussie Tech Behind F1's Victories
Fair Value AU$12.40|38.1% undervalued
TR
Community Contributor