
Advertisement
- United States
- /
- Wireless Telecom
- /
- NasdaqCM:VEON
Here's Why VEON (NASDAQ:VEON) Has A Meaningful Debt Burden
Howard Marks put it nicely when he said that, rather than worrying about share price volatility, 'The possibility of permanent loss is the risk I worry about... and every practical investor I know worries about.' It's only natural to consider a company's balance sheet when you examine how risky it is, since debt is often involved when a business collapses. We can see that VEON Ltd. (NASDAQ:VEON) does use debt in its business. But the real question is whether this debt is making the company risky.
When Is Debt Dangerous?
Debt assists a business until the business has trouble paying it off, either with new capital or with free cash flow. Part and parcel of capitalism is the process of 'creative destruction' where failed businesses are mercilessly liquidated by their bankers. However, a more frequent (but still costly) occurrence is where a company must issue shares at bargain-basement prices, permanently diluting shareholders, just to shore up its balance sheet. Having said that, the most common situation is where a company manages its debt reasonably well - and to its own advantage. The first step when considering a company's debt levels is to consider its cash and debt together.
See our latest analysis for VEON
What Is VEON's Debt?
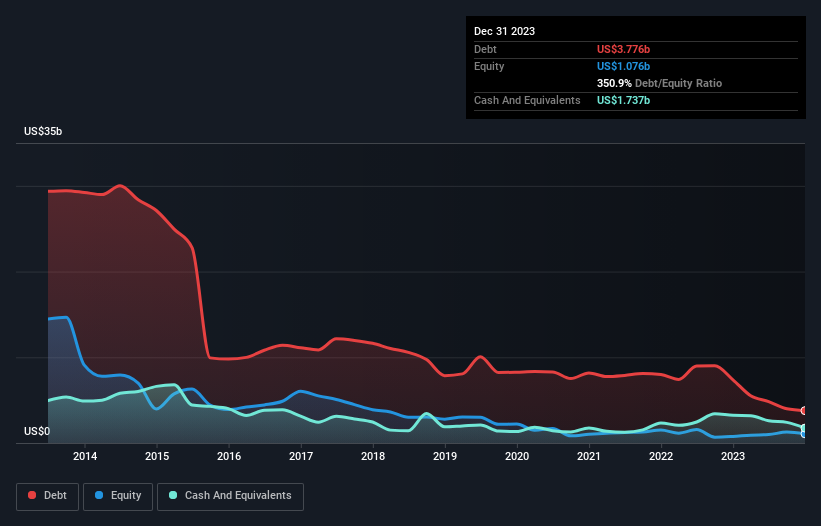
As you can see below, VEON had US$3.78b of debt at December 2023, down from US$7.37b a year prior. However, it also had US$1.74b in cash, and so its net debt is US$2.04b.
A Look At VEON's Liabilities
Zooming in on the latest balance sheet data, we can see that VEON had liabilities of US$2.20b due within 12 months and liabilities of US$4.95b due beyond that. On the other hand, it had cash of US$1.74b and US$497.0m worth of receivables due within a year. So its liabilities total US$4.91b more than the combination of its cash and short-term receivables.
This deficit casts a shadow over the US$1.66b company, like a colossus towering over mere mortals. So we'd watch its balance sheet closely, without a doubt. After all, VEON would likely require a major re-capitalisation if it had to pay its creditors today.
We use two main ratios to inform us about debt levels relative to earnings. The first is net debt divided by earnings before interest, tax, depreciation, and amortization (EBITDA), while the second is how many times its earnings before interest and tax (EBIT) covers its interest expense (or its interest cover, for short). This way, we consider both the absolute quantum of the debt, as well as the interest rates paid on it.
VEON has a very low debt to EBITDA ratio of 1.2 so it is strange to see weak interest coverage, with last year's EBIT being only 2.0 times the interest expense. So one way or the other, it's clear the debt levels are not trivial. Sadly, VEON's EBIT actually dropped 5.0% in the last year. If earnings continue on that decline then managing that debt will be difficult like delivering hot soup on a unicycle. When analysing debt levels, the balance sheet is the obvious place to start. But ultimately the future profitability of the business will decide if VEON can strengthen its balance sheet over time. So if you're focused on the future you can check out this free report showing analyst profit forecasts.
Finally, while the tax-man may adore accounting profits, lenders only accept cold hard cash. So we always check how much of that EBIT is translated into free cash flow. Over the last three years, VEON actually produced more free cash flow than EBIT. That sort of strong cash conversion gets us as excited as the crowd when the beat drops at a Daft Punk concert.
Our View
On the face of it, VEON's interest cover left us tentative about the stock, and its level of total liabilities was no more enticing than the one empty restaurant on the busiest night of the year. But at least it's pretty decent at converting EBIT to free cash flow; that's encouraging. Once we consider all the factors above, together, it seems to us that VEON's debt is making it a bit risky. That's not necessarily a bad thing, but we'd generally feel more comfortable with less leverage. When analysing debt levels, the balance sheet is the obvious place to start. However, not all investment risk resides within the balance sheet - far from it. These risks can be hard to spot. Every company has them, and we've spotted 2 warning signs for VEON (of which 1 can't be ignored!) you should know about.
If you're interested in investing in businesses that can grow profits without the burden of debt, then check out this free list of growing businesses that have net cash on the balance sheet.
New: Manage All Your Stock Portfolios in One Place
We've created the ultimate portfolio companion for stock investors, and it's free.
• Connect an unlimited number of Portfolios and see your total in one currency
• Be alerted to new Warning Signs or Risks via email or mobile
• Track the Fair Value of your stocks
Have feedback on this article? Concerned about the content? Get in touch with us directly. Alternatively, email editorial-team (at) simplywallst.com.
This article by Simply Wall St is general in nature. We provide commentary based on historical data and analyst forecasts only using an unbiased methodology and our articles are not intended to be financial advice. It does not constitute a recommendation to buy or sell any stock, and does not take account of your objectives, or your financial situation. We aim to bring you long-term focused analysis driven by fundamental data. Note that our analysis may not factor in the latest price-sensitive company announcements or qualitative material. Simply Wall St has no position in any stocks mentioned.
About NasdaqCM:VEON
VEON
A digital operator, provides telecommunications and digital services to corporate and individual customers in Pakistan, Ukraine, Kazakhstan, Uzbekistan, and Bangladesh.
Very undervalued with proven track record.
Similar Companies
Market Insights

Advertisement
Community Narratives
The Next Phase of Energy Storage: How NeoVolta Is Tackling America’s Power Crunch
Fair Value US$7.50|35.1% undervalued
MA
Community Contributor
Why EnSilica is Worth Possibly 13x its Current Price
Fair Value UK£5.00|89.8% undervalued
DO
Community Contributor
M&A Activity, Industry Diversification & A Defense Contract Monopoly Will Push BWXT For Healthy Long-Term Growth
Fair Value US$220.00|15.2% undervalued
CL
Community Contributor
A case for Cassiar Gold Corp (TSXV: GLDC) to reach CAD$8-10 before 2030 (X30-37)
Fair Value CA$10.00|96.0% undervalued
AG
Community Contributor