Advertisement
- United States
- /
- Telecom Services and Carriers
- /
- NasdaqGS:ASTS
A Fresh Look at AST SpaceMobile (ASTS) Valuation After Satellite Launch Milestones and Space-Based 4G Breakthroughs

Simply Wall St
Reviewed by Kshitija Bhandaru
AST SpaceMobile (ASTS) just hit an important milestone by completing final assembly and testing of its BlueBird 6 satellite and preparing it for launch. At the same time, the company and Bell Canada demonstrated 4G voice, video, and data connections directly from space using everyday smartphones.
See our latest analysis for AST SpaceMobile.
AST SpaceMobile’s recent string of milestones, including its successful 4G space-based demo with Bell Canada, fresh satellite assembly wins, and rapid launch roadmap, has clearly boosted market enthusiasm. That confidence is reflected in its 1-year total shareholder return of 1.6%, alongside a steady year-to-date share price gain. This suggests momentum is building as the company’s expansion efforts gain credibility with both investors and telecom partners.
Curious which other companies are making waves in wireless and satellite tech? There’s no better time to check out the full list with See the full list for free.
But with the stock at all-time highs and analyst targets climbing, investors are left to consider whether AST SpaceMobile is trading below its true potential or if the market has already priced in years of rapid satellite-fueled growth.
Price-to-Book Ratio of 21x: Is it justified?
AST SpaceMobile currently trades at a price-to-book ratio of 21x, significantly higher than both the US Telecom industry average and its peer group.
The price-to-book ratio measures how much investors are paying for each dollar of company net assets. In capital-intensive sectors like telecom, this ratio can signal investor expectations around asset productivity or future profitability, particularly for disruptive or high-growth players.
At 21x, AST SpaceMobile’s multiple dwarfs the industry average of 1.5x and the peer average of 4.7x. Such a premium suggests the market is anticipating groundbreaking growth or a strategic advantage, but it also means expectations are sky-high. This leaves little room for missteps or delays in commercialization.
See what the numbers say about this price — find out in our valuation breakdown.
Result: Price-to-Book Ratio of 21x (OVERVALUED)
However, risks remain if commercialization timelines slip or if fierce competition erodes AST SpaceMobile’s perceived technological advantage. This could challenge the current lofty valuation.
Find out about the key risks to this AST SpaceMobile narrative.
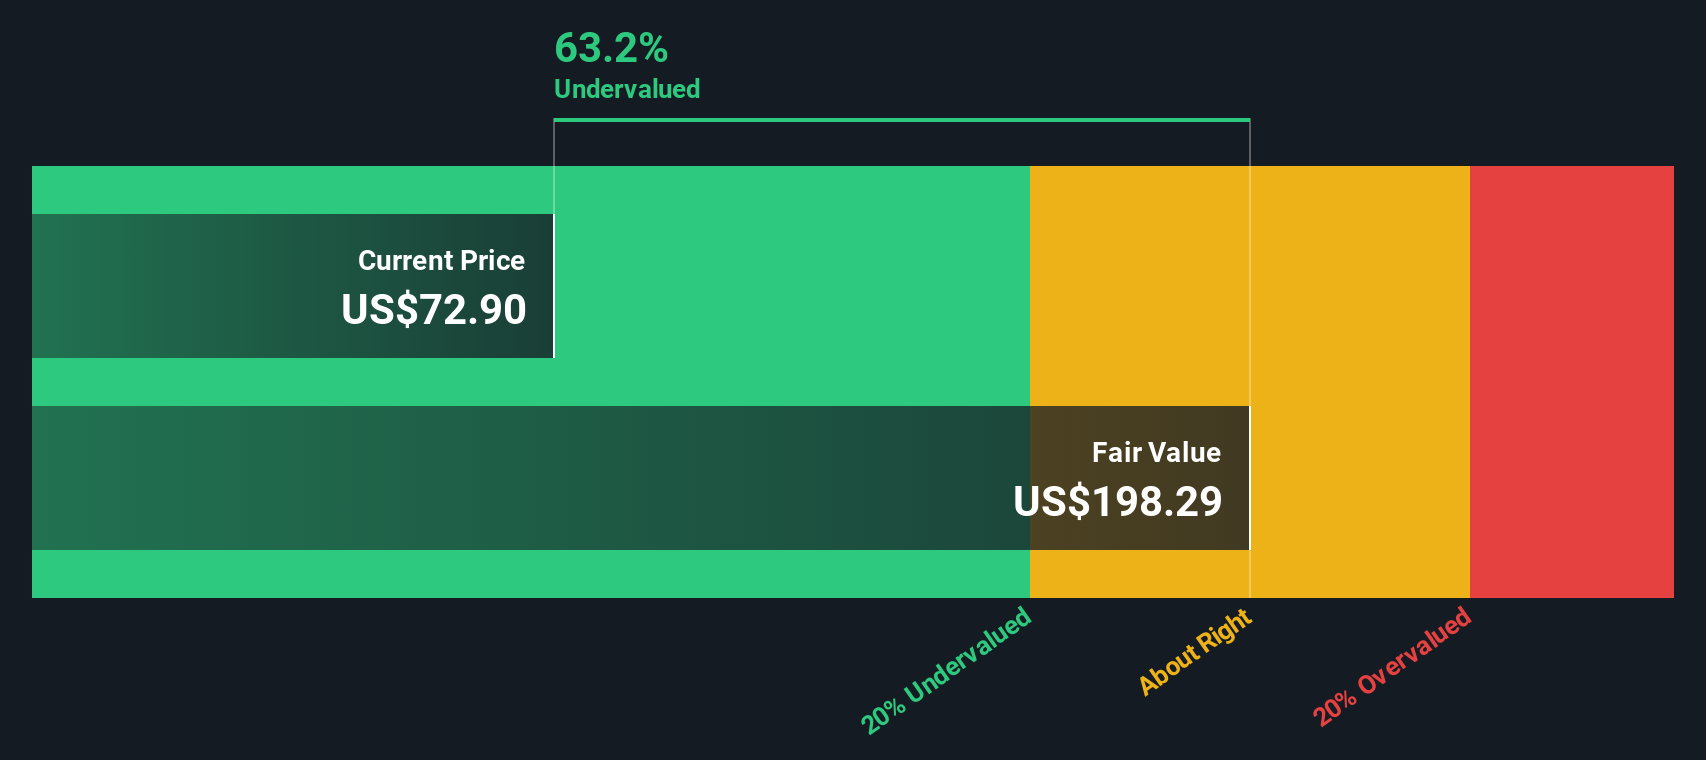
Another View: DCF Points to Undervaluation
While the current price-to-book ratio makes AST SpaceMobile look expensive, our DCF model suggests a different story. The SWS DCF model values shares at $198.29, which is a significant premium compared to today’s $67.76 price. Is the market missing something or simply playing it safe?
Look into how the SWS DCF model arrives at its fair value.
Simply Wall St performs a discounted cash flow (DCF) on every stock in the world every day (check out AST SpaceMobile for example). We show the entire calculation in full. You can track the result in your watchlist or portfolio and be alerted when this changes, or use our stock screener to discover undervalued stocks based on their cash flows. If you save a screener we even alert you when new companies match - so you never miss a potential opportunity.
Build Your Own AST SpaceMobile Narrative
If you see things differently or want to dig into the numbers yourself, creating your own view on AST SpaceMobile takes just a few minutes. So why not Do it your way?
A great starting point for your AST SpaceMobile research is our analysis highlighting 2 key rewards and 4 important warning signs that could impact your investment decision.
Looking for more investment ideas?
Don’t miss your chance to get ahead and expand your research with powerful stock shortlists curated by Simply Wall Street’s screener. These tailored picks could spark your next big move.
- Supercharge your portfolio with these 896 undervalued stocks based on cash flows, packed with companies trading below their intrinsic value and waiting to be recognized by the market.
- Uncover the next wave of medical innovation as you browse these 32 healthcare AI stocks, featuring firms at the forefront of AI-driven healthcare solutions.
- Boost your passive income strategy with these 19 dividend stocks with yields > 3%, a selection of stocks yielding strong and consistent returns.
This article by Simply Wall St is general in nature. We provide commentary based on historical data and analyst forecasts only using an unbiased methodology and our articles are not intended to be financial advice. It does not constitute a recommendation to buy or sell any stock, and does not take account of your objectives, or your financial situation. We aim to bring you long-term focused analysis driven by fundamental data. Note that our analysis may not factor in the latest price-sensitive company announcements or qualitative material. Simply Wall St has no position in any stocks mentioned.
New: Manage All Your Stock Portfolios in One Place
We've created the ultimate portfolio companion for stock investors, and it's free.
• Connect an unlimited number of Portfolios and see your total in one currency
• Be alerted to new Warning Signs or Risks via email or mobile
• Track the Fair Value of your stocks
Have feedback on this article? Concerned about the content? Get in touch with us directly. Alternatively, email editorial-team@simplywallst.com
About NasdaqGS:ASTS
AST SpaceMobile
Designs and develops the constellation of BlueBird satellites in the United States.
Exceptional growth potential with excellent balance sheet.
Similar Companies
Market Insights

Advertisement
Weekly Picks
RO


RockeTeller on Santacruz Silver Mining ·
Crazy Undervalued 42 Baggers Silver Play (Active & Running Mine)
Fair Value:CA$8696.7% undervalued
66 followersusers have followed this narrative
7 commentsusers have commented on this narrative
20 likesusers have liked this narrative
RO


Robbo on Fiducian Group ·
Fiducian: Compliance Clouds or Value Opportunity?
Fair Value:AU$123.9% undervalued
10 followersusers have followed this narrative
0 commentsusers have commented on this narrative
0 likesusers have liked this narrative
WO

woodworthfund on Willamette Valley Vineyards ·
Willamette Valley Vineyards (WVVI): Not-So-Great Value
Fair Value:US$242.5% overvalued
11 followersusers have followed this narrative
0 commentsusers have commented on this narrative
1 likeusers have liked this narrative
Recently Updated Narratives
EN

Enemy on Halyk Bank of Kazakhstan ·
Halyk Bank of Kazakhstan will see revenue grow 11% as their future PE reaches 3.2x soon
Fair Value:US$52.2351.3% undervalued
1 followerusers have followed this narrative
0 commentsusers have commented on this narrative
0 likesusers have liked this narrative
IN

IncomeAssets on Magma Silver ·
Silver's Breakout to over $50US will make Magma’s future shine with drill sampling returning 115g/t Silver and 2.3 g/t Gold at its Peru Mine
Fair Value:CA$0.3534.3% undervalued
4 followersusers have followed this narrative
0 commentsusers have commented on this narrative
0 likesusers have liked this narrative
CO

composite32 on SEGRO ·
SEGRO's Revenue to Rise 14.7% Amidst Optimistic Growth Plans
Fair Value:UK£9.3924.7% undervalued
1 followerusers have followed this narrative
0 commentsusers have commented on this narrative
0 likesusers have liked this narrative
Popular Narratives
TH


TheWallstreetKing on MicroVision ·
MicroVision will explode future revenue by 380.37% with a vision towards success
Fair Value:US$6098.5% undervalued
118 followersusers have followed this narrative
11 commentsusers have commented on this narrative
22 likesusers have liked this narrative
AN


AnalystConsensusTarget on NVIDIA ·
NVDA: Expanding AI Demand Will Drive Major Data Center Investments Through 2026
Fair Value:US$250.3927.2% undervalued
959 followersusers have followed this narrative
6 commentsusers have commented on this narrative
25 likesusers have liked this narrative
RO
RockeTeller on Santacruz Silver Mining ·
Crazy Undervalued 42 Baggers Silver Play (Active & Running Mine)
Fair Value:CA$8696.7% undervalued
66 followersusers have followed this narrative
7 commentsusers have commented on this narrative
20 likesusers have liked this narrative
