These 4 Measures Indicate That Teledyne Technologies (NYSE:TDY) Is Using Debt Reasonably Well


Warren Buffett famously said, 'Volatility is far from synonymous with risk.' When we think about how risky a company is, we always like to look at its use of debt, since debt overload can lead to ruin. As with many other companies Teledyne Technologies Incorporated (NYSE:TDY) makes use of debt. But should shareholders be worried about its use of debt?
What Risk Does Debt Bring?
Debt and other liabilities become risky for a business when it cannot easily fulfill those obligations, either with free cash flow or by raising capital at an attractive price. In the worst case scenario, a company can go bankrupt if it cannot pay its creditors. However, a more usual (but still expensive) situation is where a company must dilute shareholders at a cheap share price simply to get debt under control. Having said that, the most common situation is where a company manages its debt reasonably well - and to its own advantage. The first thing to do when considering how much debt a business uses is to look at its cash and debt together.
View our latest analysis for Teledyne Technologies
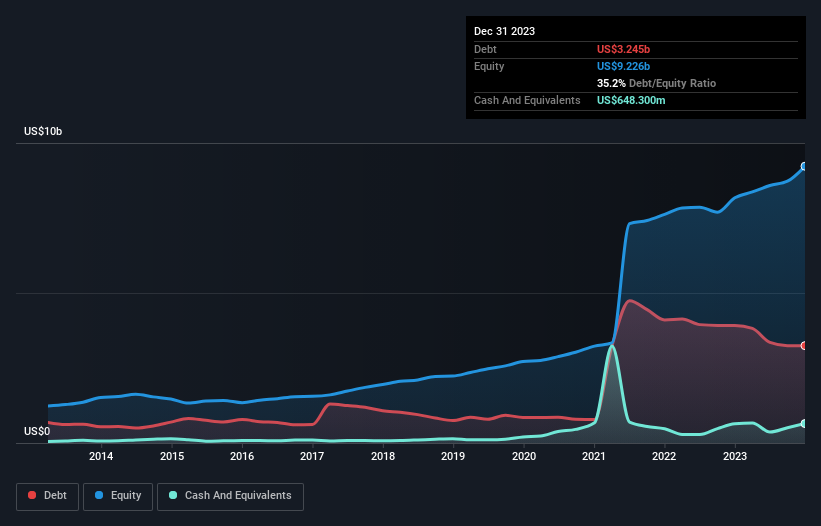
How Much Debt Does Teledyne Technologies Carry?
The image below, which you can click on for greater detail, shows that Teledyne Technologies had debt of US$3.24b at the end of December 2023, a reduction from US$3.92b over a year. However, it also had US$648.3m in cash, and so its net debt is US$2.60b.
How Healthy Is Teledyne Technologies' Balance Sheet?
Zooming in on the latest balance sheet data, we can see that Teledyne Technologies had liabilities of US$1.77b due within 12 months and liabilities of US$3.54b due beyond that. Offsetting this, it had US$648.3m in cash and US$1.20b in receivables that were due within 12 months. So its liabilities outweigh the sum of its cash and (near-term) receivables by US$3.45b.
Given Teledyne Technologies has a humongous market capitalization of US$20.4b, it's hard to believe these liabilities pose much threat. However, we do think it is worth keeping an eye on its balance sheet strength, as it may change over time.
We measure a company's debt load relative to its earnings power by looking at its net debt divided by its earnings before interest, tax, depreciation, and amortization (EBITDA) and by calculating how easily its earnings before interest and tax (EBIT) cover its interest expense (interest cover). This way, we consider both the absolute quantum of the debt, as well as the interest rates paid on it.
Teledyne Technologies's net debt to EBITDA ratio of about 1.9 suggests only moderate use of debt. And its strong interest cover of 13.5 times, makes us even more comfortable. Teledyne Technologies grew its EBIT by 6.5% in the last year. That's far from incredible but it is a good thing, when it comes to paying off debt. There's no doubt that we learn most about debt from the balance sheet. But ultimately the future profitability of the business will decide if Teledyne Technologies can strengthen its balance sheet over time. So if you're focused on the future you can check out this free report showing analyst profit forecasts.
Finally, a business needs free cash flow to pay off debt; accounting profits just don't cut it. So we always check how much of that EBIT is translated into free cash flow. Over the most recent three years, Teledyne Technologies recorded free cash flow worth 67% of its EBIT, which is around normal, given free cash flow excludes interest and tax. This cold hard cash means it can reduce its debt when it wants to.
Our View
Teledyne Technologies's interest cover suggests it can handle its debt as easily as Cristiano Ronaldo could score a goal against an under 14's goalkeeper. And the good news does not stop there, as its conversion of EBIT to free cash flow also supports that impression! When we consider the range of factors above, it looks like Teledyne Technologies is pretty sensible with its use of debt. While that brings some risk, it can also enhance returns for shareholders. Above most other metrics, we think its important to track how fast earnings per share is growing, if at all. If you've also come to that realization, you're in luck, because today you can view this interactive graph of Teledyne Technologies's earnings per share history for free.
At the end of the day, it's often better to focus on companies that are free from net debt. You can access our special list of such companies (all with a track record of profit growth). It's free.
If you're looking to trade Teledyne Technologies, open an account with the lowest-cost platform trusted by professionals, Interactive Brokers.
With clients in over 200 countries and territories, and access to 160 markets, IBKR lets you trade stocks, options, futures, forex, bonds and funds from a single integrated account.
Enjoy no hidden fees, no account minimums, and FX conversion rates as low as 0.03%, far better than what most brokers offer.
Sponsored ContentValuation is complex, but we're here to simplify it.
Discover if Teledyne Technologies might be undervalued or overvalued with our detailed analysis, featuring fair value estimates, potential risks, dividends, insider trades, and its financial condition.
Access Free AnalysisHave feedback on this article? Concerned about the content? Get in touch with us directly. Alternatively, email editorial-team (at) simplywallst.com.
This article by Simply Wall St is general in nature. We provide commentary based on historical data and analyst forecasts only using an unbiased methodology and our articles are not intended to be financial advice. It does not constitute a recommendation to buy or sell any stock, and does not take account of your objectives, or your financial situation. We aim to bring you long-term focused analysis driven by fundamental data. Note that our analysis may not factor in the latest price-sensitive company announcements or qualitative material. Simply Wall St has no position in any stocks mentioned.
About NYSE:TDY
Teledyne Technologies
Provides enabling technologies for industrial growth markets in the United States and internationally.
Excellent balance sheet and fair value.
