
Legendary fund manager Li Lu (who Charlie Munger backed) once said, 'The biggest investment risk is not the volatility of prices, but whether you will suffer a permanent loss of capital.' When we think about how risky a company is, we always like to look at its use of debt, since debt overload can lead to ruin. As with many other companies PAR Technology Corporation (NYSE:PAR) makes use of debt. But the real question is whether this debt is making the company risky.
Why Does Debt Bring Risk?
Debt assists a business until the business has trouble paying it off, either with new capital or with free cash flow. In the worst case scenario, a company can go bankrupt if it cannot pay its creditors. However, a more common (but still painful) scenario is that it has to raise new equity capital at a low price, thus permanently diluting shareholders. Of course, the upside of debt is that it often represents cheap capital, especially when it replaces dilution in a company with the ability to reinvest at high rates of return. The first step when considering a company's debt levels is to consider its cash and debt together.
What Is PAR Technology's Debt?
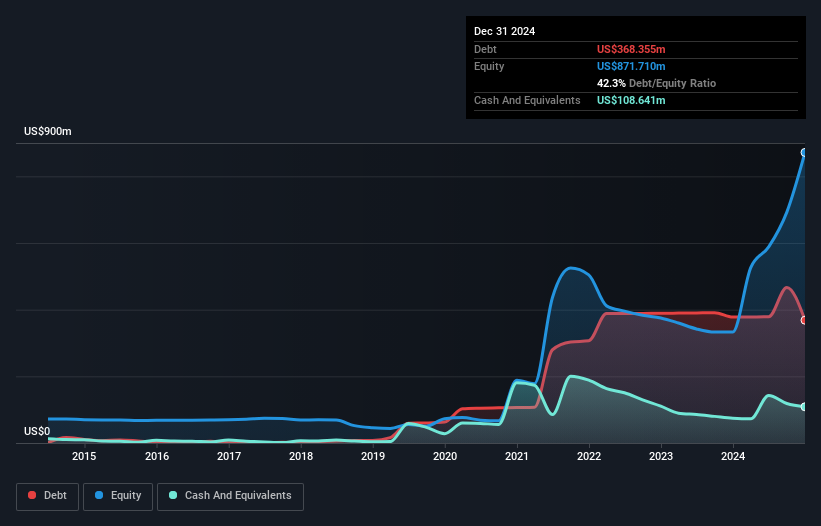
As you can see below, PAR Technology had US$368.4m of debt, at December 2024, which is about the same as the year before. You can click the chart for greater detail. On the flip side, it has US$108.6m in cash leading to net debt of about US$259.7m.
How Strong Is PAR Technology's Balance Sheet?
Zooming in on the latest balance sheet data, we can see that PAR Technology had liabilities of US$111.8m due within 12 months and liabilities of US$397.2m due beyond that. Offsetting this, it had US$108.6m in cash and US$59.7m in receivables that were due within 12 months. So it has liabilities totalling US$340.7m more than its cash and near-term receivables, combined.
Of course, PAR Technology has a market capitalization of US$2.26b, so these liabilities are probably manageable. Having said that, it's clear that we should continue to monitor its balance sheet, lest it change for the worse. The balance sheet is clearly the area to focus on when you are analysing debt. But ultimately the future profitability of the business will decide if PAR Technology can strengthen its balance sheet over time. So if you're focused on the future you can check out this free report showing analyst profit forecasts.
See our latest analysis for PAR Technology
In the last year PAR Technology wasn't profitable at an EBIT level, but managed to grow its revenue by 26%, to US$350m. With any luck the company will be able to grow its way to profitability.
Caveat Emptor
Despite the top line growth, PAR Technology still had an earnings before interest and tax (EBIT) loss over the last year. To be specific the EBIT loss came in at US$80m. When we look at that and recall the liabilities on its balance sheet, relative to cash, it seems unwise to us for the company to have any debt. Quite frankly we think the balance sheet is far from match-fit, although it could be improved with time. Another cause for caution is that is bled US$32m in negative free cash flow over the last twelve months. So to be blunt we think it is risky. When analysing debt levels, the balance sheet is the obvious place to start. But ultimately, every company can contain risks that exist outside of the balance sheet. These risks can be hard to spot. Every company has them, and we've spotted 1 warning sign for PAR Technology you should know about.
If you're interested in investing in businesses that can grow profits without the burden of debt, then check out this free list of growing businesses that have net cash on the balance sheet.
The New Payments ETF Is Live on NASDAQ:
Money is moving to real-time rails, and a newly listed ETF now gives investors direct exposure. Fast settlement. Institutional custody. Simple access.
Explore how this launch could reshape portfolios
Sponsored ContentNew: Manage All Your Stock Portfolios in One Place
We've created the ultimate portfolio companion for stock investors, and it's free.
• Connect an unlimited number of Portfolios and see your total in one currency
• Be alerted to new Warning Signs or Risks via email or mobile
• Track the Fair Value of your stocks
Have feedback on this article? Concerned about the content? Get in touch with us directly. Alternatively, email editorial-team (at) simplywallst.com.
This article by Simply Wall St is general in nature. We provide commentary based on historical data and analyst forecasts only using an unbiased methodology and our articles are not intended to be financial advice. It does not constitute a recommendation to buy or sell any stock, and does not take account of your objectives, or your financial situation. We aim to bring you long-term focused analysis driven by fundamental data. Note that our analysis may not factor in the latest price-sensitive company announcements or qualitative material. Simply Wall St has no position in any stocks mentioned.
About NYSE:PAR
PAR Technology
Provides omnichannel cloud-based hardware and software solutions to the worldwide.
Good value with adequate balance sheet.
Similar Companies
Market Insights

Weekly Picks

Early mover in a fast growing industry. Likely to experience share price volatility as they scale


A case for CA$31.80 (undiluted), aka 8,616% upside from CA$0.37 (an 86 bagger!).


Moderation and Stabilisation: HOLD: Fair Price based on a 4-year Cycle is $12.08
Recently Updated Narratives

Airbnb Stock: Platform Growth in a World of Saturation and Scrutiny

Adobe Stock: AI-Fueled ARR Growth Pushes Guidance Higher, But Cost Pressures Loom

Thomson Reuters Stock: When Legal Intelligence Becomes Mission-Critical Infrastructure
Popular Narratives


Crazy Undervalued 42 Baggers Silver Play (Active & Running Mine)


NVDA: Expanding AI Demand Will Drive Major Data Center Investments Through 2026

The AI Infrastructure Giant Grows Into Its Valuation
Trending Discussion


