Advertisement
- United States
- /
- Tech Hardware
- /
- NYSE:HPE
Assessing HPE After AI-Powered Cloud Momentum and Recent Double-Digit Share Price Gains

Simply Wall St
Reviewed by Bailey Pemberton
Wondering whether now is the right time to make a move on Hewlett Packard Enterprise stock? You are far from alone. With the tech landscape shifting fast, HPE has been quietly notching double-digit gains, and plenty of investors are trying to figure out if there is still room to run or if this train has left the station.
Over the past year, HPE’s stock has delivered a striking 22.1% return, and if you zoom out to five years, the share price has soared an eye-catching 190.6%. Even just in the last month, HPE managed a 5.4% bump, outpacing many peers. Recent market developments, especially increased demand for enterprise cloud infrastructure and continued momentum in AI-driven workloads, seem to have fueled investor optimism, nudging up risk appetites and driving sustained buying interest in companies like HPE.
But the big question remains: is HPE actually undervalued, or are investors getting ahead of themselves? By the numbers, HPE tallies a value score of 3 out of 6, meaning it checks the box for undervaluation in 3 major methods analysts look at. That signals potential, but also some reasons to dig deeper.
Let’s break down those valuation approaches one by one, sizing up where HPE looks cheap and where it might be fairly priced already. And stick around. Beyond the typical methods, there is an even sharper way to cut through the noise that we will get to at the end.
Approach 1: Hewlett Packard Enterprise Discounted Cash Flow (DCF) Analysis
The Discounted Cash Flow (DCF) model estimates a company’s intrinsic value by projecting its future cash flows and discounting them back to their value today. This approach aims to capture the true worth of a business based on its expected ability to generate cash for investors over time, rather than just relying on reported profits.
For Hewlett Packard Enterprise, the most recent twelve months saw a Free Cash Flow (FCF) of negative $344 Million, reflecting some recent outflows. However, analyst forecasts expect a turnaround, projecting FCF to reach $3.54 Billion by 2028, with estimates for the next decade climbing as high as $6.41 Billion by 2035. Only five years of analyst forecasts are available, so further-out projections rely on trend extrapolations. All numbers are in US dollars.
When these cash flows are discounted to the present using the 2 Stage Free Cash Flow to Equity model, the resulting estimated intrinsic value per share is $47.71. This represents an implied discount of 48.0% compared to the current share price, indicating that the market may be significantly underpricing HPE’s potential.
Result: UNDERVALUED
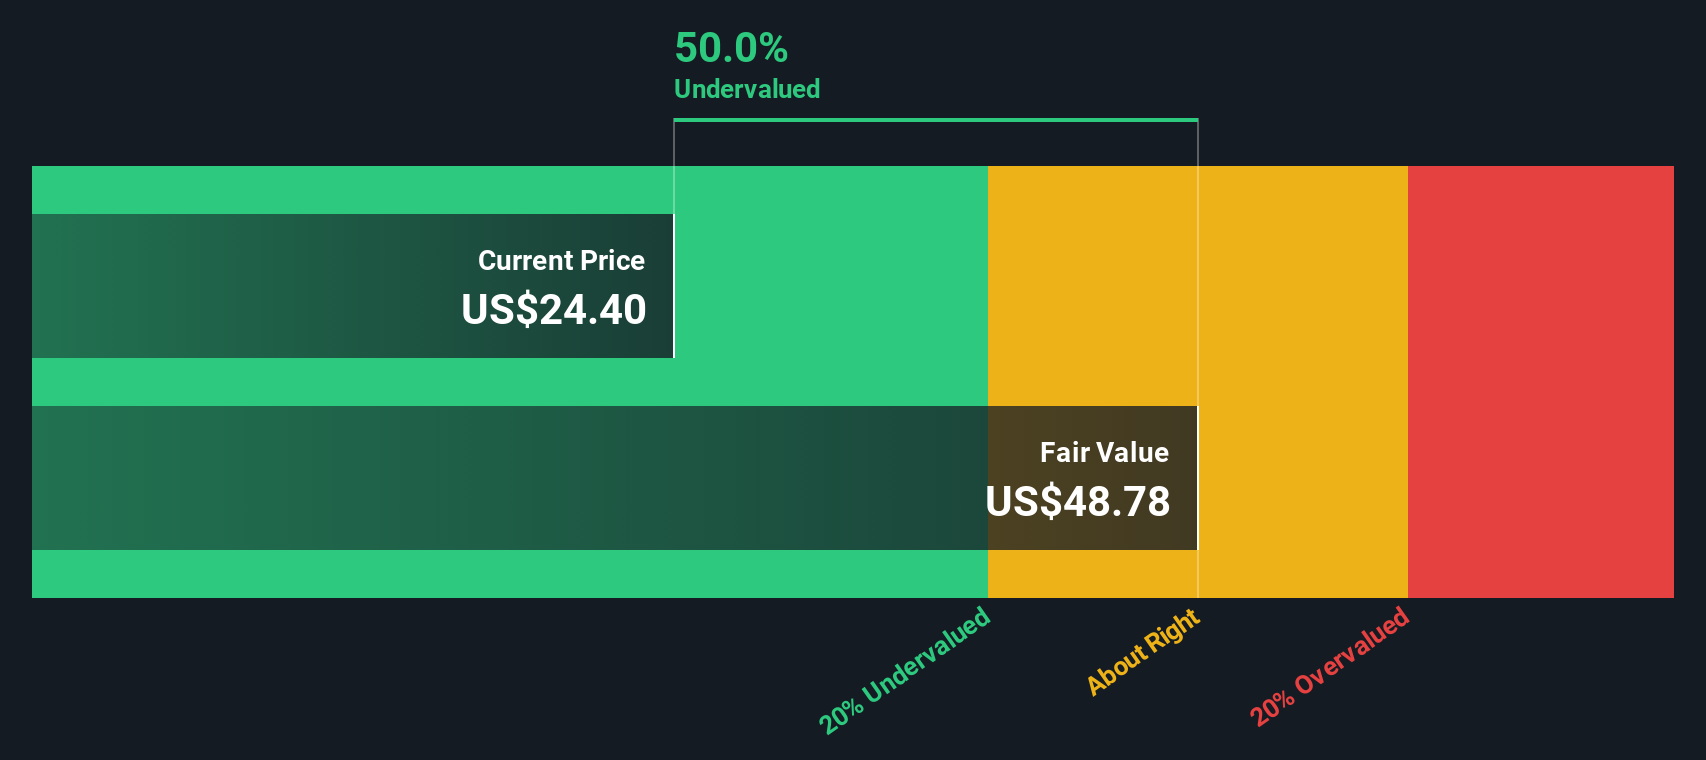
Our Discounted Cash Flow (DCF) analysis suggests Hewlett Packard Enterprise is undervalued by 48.0%. Track this in your watchlist or portfolio, or discover more undervalued stocks.
Approach 2: Hewlett Packard Enterprise Price vs Earnings
The Price-to-Earnings (PE) ratio is a go-to valuation metric for profitable companies like Hewlett Packard Enterprise because it directly ties share price to actual earnings performance, making it a practical tool for investors assessing value. A company's "normal" or "fair" PE ratio is shaped by several factors, especially its expected earnings growth and its risk profile. Higher growth prospects typically justify a higher PE, while greater risks or uncertainties usually demand a discount.
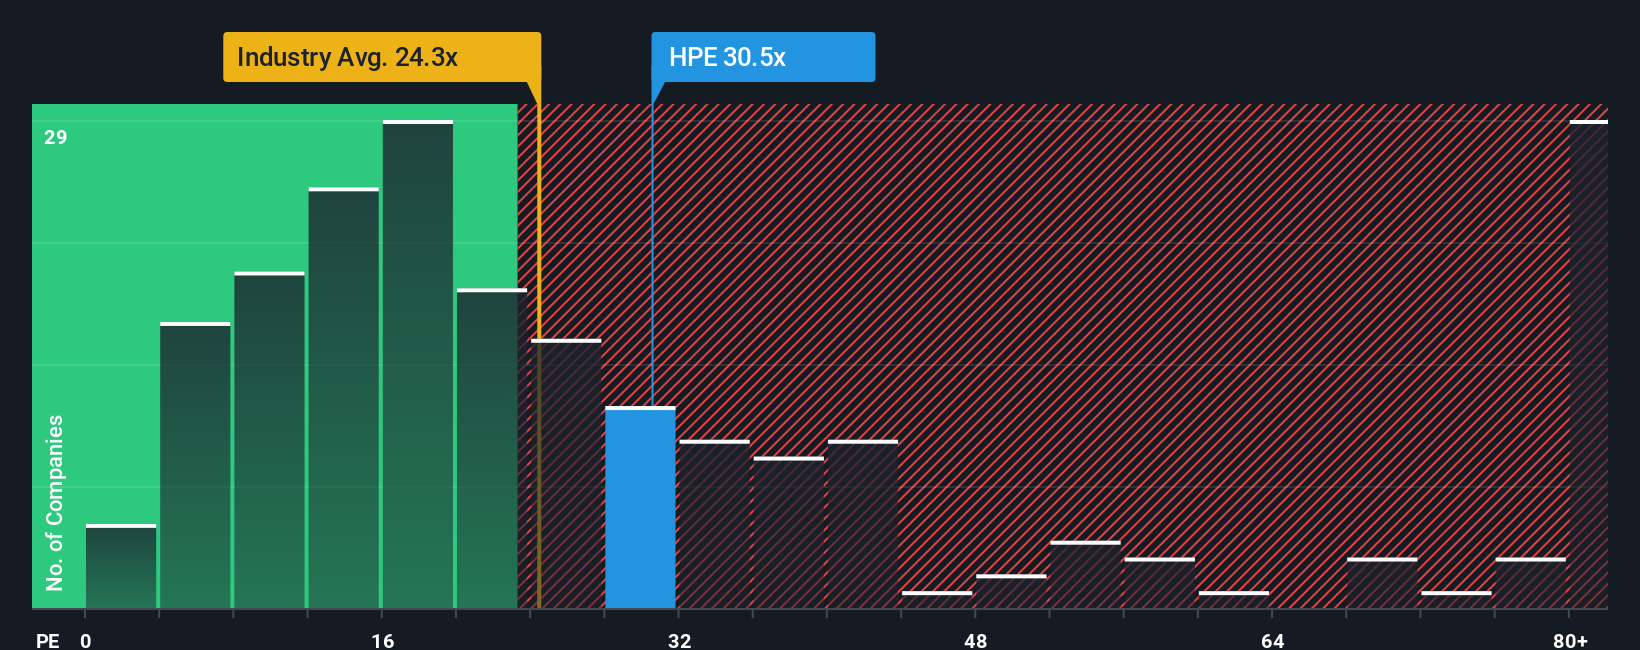
Currently, Hewlett Packard Enterprise trades at a PE ratio of 28.8x. For perspective, this sits above both the average PE of its industry at 24.0x and the peer group average of 23.1x. On the surface, HPE looks more expensive compared to many direct competitors and the broader tech sector.
However, a more nuanced approach comes from Simply Wall St’s proprietary “Fair Ratio.” This metric considers not just peer and industry averages, but also the company’s unique earnings growth outlook, profit margins, market cap, and risk factors. By blending all this information, the Fair Ratio aims to paint a clearer and more tailored valuation picture than simple comparisons.
For Hewlett Packard Enterprise, the Fair Ratio is calculated at 47.4x. Compared to HPE’s current PE of 28.8x, this suggests the stock is trading well below the level you would expect given its fundamentals, growth potential, and sector risks.
Result: UNDERVALUED
PE ratios tell one story, but what if the real opportunity lies elsewhere? Discover companies where insiders are betting big on explosive growth.
Upgrade Your Decision Making: Choose your Hewlett Packard Enterprise Narrative
Earlier we mentioned that there is an even better way to understand valuation, so let’s introduce you to Narratives. A Narrative is your way to give a story behind the numbers: it is the perspective you have on a company’s future, where revenue, earnings, and profit margins are headed, and how those expectations translate into what you believe the fair value of the stock should be.
Think of Narratives as a bridge that connects your view of Hewlett Packard Enterprise’s journey to a tailored financial forecast and a personal fair value. Narratives are simple and accessible on Simply Wall St’s Community page, trusted by millions of investors.
As you or other investors update their assumptions, whether because of new earnings reports, news, or industry developments, Narratives recalculate fair value automatically, showing at a glance whether Hewlett Packard Enterprise’s current price is above or below your “story-based” target. This means you can quickly tell if it might be time to buy, hold, or sell, all based on the outlook you believe in.
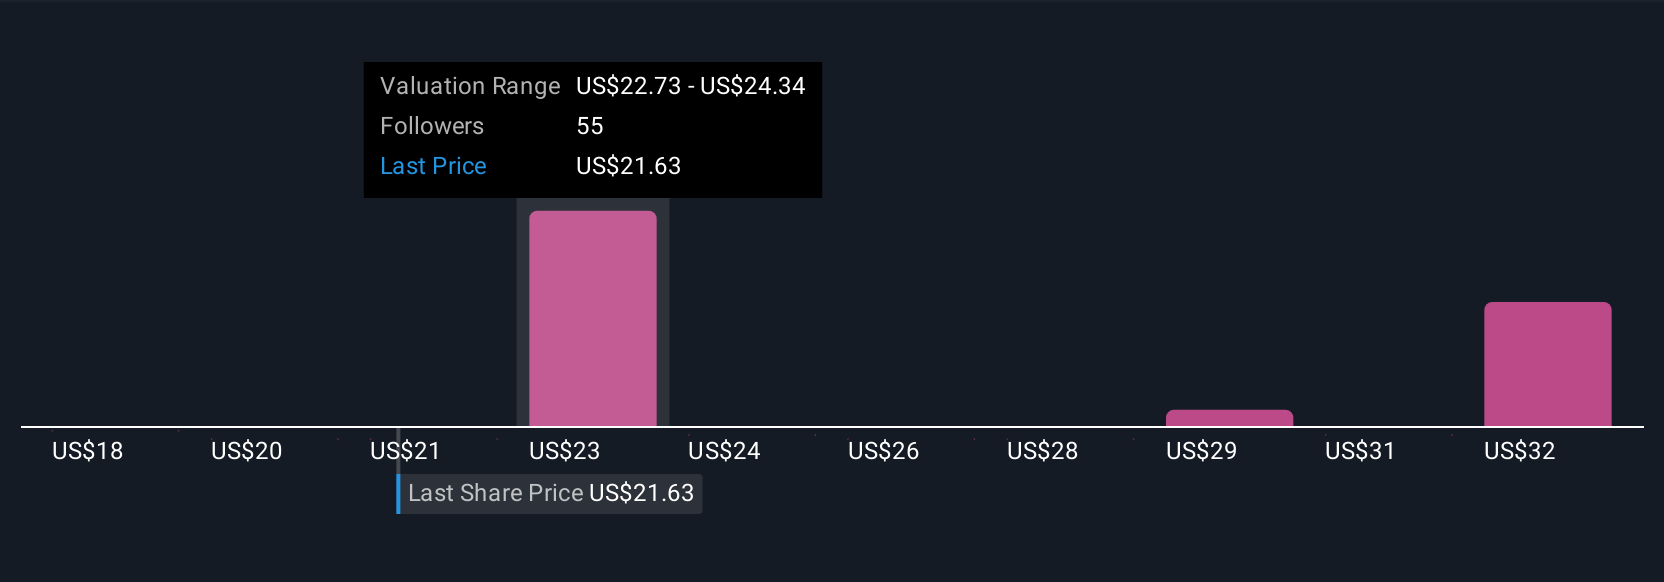
For instance, right now, some investors see surging AI and cloud adoption as game changers and estimate a fair value as high as $30.0 per share, while others remain cautious about legacy risks, putting their fair value closer to $19.0. Your own Narrative could fit anywhere in between, helping you act with more conviction.
Do you think there's more to the story for Hewlett Packard Enterprise? Create your own Narrative to let the Community know!
This article by Simply Wall St is general in nature. We provide commentary based on historical data and analyst forecasts only using an unbiased methodology and our articles are not intended to be financial advice. It does not constitute a recommendation to buy or sell any stock, and does not take account of your objectives, or your financial situation. We aim to bring you long-term focused analysis driven by fundamental data. Note that our analysis may not factor in the latest price-sensitive company announcements or qualitative material. Simply Wall St has no position in any stocks mentioned.
Valuation is complex, but we're here to simplify it.
Discover if Hewlett Packard Enterprise might be undervalued or overvalued with our detailed analysis, featuring fair value estimates, potential risks, dividends, insider trades, and its financial condition.
Access Free AnalysisHave feedback on this article? Concerned about the content? Get in touch with us directly. Alternatively, email editorial-team@simplywallst.com
About NYSE:HPE
Hewlett Packard Enterprise
Provides solutions that allow customers to capture, analyze, and act upon data seamlessly.
Moderate risk average dividend payer.
Similar Companies
Market Insights

Advertisement
Community Narratives
The Next Phase of Energy Storage: How NeoVolta Is Tackling America’s Power Crunch
Fair Value US$7.50|30.4% undervalued
MA
Community Contributor
A formidable player in AI and enterprise computing.
Fair Value US$210.00|3.0% undervalued
CO
Community Contributor
IREN's Bold Moves in Sustainable Bitcoin Mining & AI Data Centers
Fair Value US$72.52|20.4% undervalued
BL
Community Contributor
Cooling the Champions: The Aussie Tech Behind F1's Victories
Fair Value AU$12.40|38.1% undervalued
TR
Community Contributor