- United States
- /
- Tech Hardware
- /
- NYSE:HPE
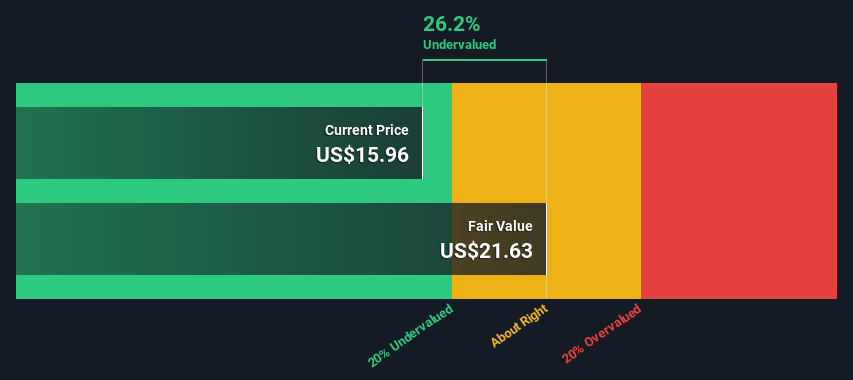
An Intrinsic Calculation For Hewlett Packard Enterprise Company (NYSE:HPE) Suggests It's 26% Undervalued


Key Insights
- The projected fair value for Hewlett Packard Enterprise is US$21.63 based on 2 Stage Free Cash Flow to Equity
- Hewlett Packard Enterprise is estimated to be 26% undervalued based on current share price of US$15.96
- The US$17.92 analyst price target for HPE is 17% less than our estimate of fair value
In this article we are going to estimate the intrinsic value of Hewlett Packard Enterprise Company (NYSE:HPE) by taking the expected future cash flows and discounting them to today's value. One way to achieve this is by employing the Discounted Cash Flow (DCF) model. It may sound complicated, but actually it is quite simple!
Remember though, that there are many ways to estimate a company's value, and a DCF is just one method. Anyone interested in learning a bit more about intrinsic value should have a read of the Simply Wall St analysis model.
Check out our latest analysis for Hewlett Packard Enterprise
The Model
We are going to use a two-stage DCF model, which, as the name states, takes into account two stages of growth. The first stage is generally a higher growth period which levels off heading towards the terminal value, captured in the second 'steady growth' period. To start off with, we need to estimate the next ten years of cash flows. Where possible we use analyst estimates, but when these aren't available we extrapolate the previous free cash flow (FCF) from the last estimate or reported value. We assume companies with shrinking free cash flow will slow their rate of shrinkage, and that companies with growing free cash flow will see their growth rate slow, over this period. We do this to reflect that growth tends to slow more in the early years than it does in later years.
A DCF is all about the idea that a dollar in the future is less valuable than a dollar today, so we discount the value of these future cash flows to their estimated value in today's dollars:
10-year free cash flow (FCF) estimate
| 2024 | 2025 | 2026 | 2027 | 2028 | 2029 | 2030 | 2031 | 2032 | 2033 | |
| Levered FCF ($, Millions) | US$2.07b | US$2.19b | US$2.28b | US$2.36b | US$2.44b | US$2.51b | US$2.58b | US$2.64b | US$2.71b | US$2.77b |
| Growth Rate Estimate Source | Analyst x4 | Analyst x2 | Est @ 4.20% | Est @ 3.61% | Est @ 3.19% | Est @ 2.90% | Est @ 2.70% | Est @ 2.55% | Est @ 2.45% | Est @ 2.38% |
| Present Value ($, Millions) Discounted @ 10% | US$1.9k | US$1.8k | US$1.7k | US$1.6k | US$1.5k | US$1.4k | US$1.3k | US$1.2k | US$1.1k | US$1.0k |
("Est" = FCF growth rate estimated by Simply Wall St)
Present Value of 10-year Cash Flow (PVCF) = US$15b
We now need to calculate the Terminal Value, which accounts for all the future cash flows after this ten year period. The Gordon Growth formula is used to calculate Terminal Value at a future annual growth rate equal to the 5-year average of the 10-year government bond yield of 2.2%. We discount the terminal cash flows to today's value at a cost of equity of 10%.
Terminal Value (TV)= FCF2033 × (1 + g) ÷ (r – g) = US$2.8b× (1 + 2.2%) ÷ (10%– 2.2%) = US$35b
Present Value of Terminal Value (PVTV)= TV / (1 + r)10= US$35b÷ ( 1 + 10%)10= US$13b
The total value, or equity value, is then the sum of the present value of the future cash flows, which in this case is US$28b. To get the intrinsic value per share, we divide this by the total number of shares outstanding. Relative to the current share price of US$16.0, the company appears a touch undervalued at a 26% discount to where the stock price trades currently. Valuations are imprecise instruments though, rather like a telescope - move a few degrees and end up in a different galaxy. Do keep this in mind.
The Assumptions
The calculation above is very dependent on two assumptions. The first is the discount rate and the other is the cash flows. If you don't agree with these result, have a go at the calculation yourself and play with the assumptions. The DCF also does not consider the possible cyclicality of an industry, or a company's future capital requirements, so it does not give a full picture of a company's potential performance. Given that we are looking at Hewlett Packard Enterprise as potential shareholders, the cost of equity is used as the discount rate, rather than the cost of capital (or weighted average cost of capital, WACC) which accounts for debt. In this calculation we've used 10%, which is based on a levered beta of 1.612. Beta is a measure of a stock's volatility, compared to the market as a whole. We get our beta from the industry average beta of globally comparable companies, with an imposed limit between 0.8 and 2.0, which is a reasonable range for a stable business.
SWOT Analysis for Hewlett Packard Enterprise
- Debt is well covered by earnings and cashflows.
- Dividends are covered by earnings and cash flows.
- Earnings declined over the past year.
- Dividend is low compared to the top 25% of dividend payers in the Tech market.
- Annual earnings are forecast to grow faster than the American market.
- Good value based on P/E ratio and estimated fair value.
- Annual revenue is forecast to grow slower than the American market.
Moving On:
Although the valuation of a company is important, it ideally won't be the sole piece of analysis you scrutinize for a company. The DCF model is not a perfect stock valuation tool. Rather it should be seen as a guide to "what assumptions need to be true for this stock to be under/overvalued?" If a company grows at a different rate, or if its cost of equity or risk free rate changes sharply, the output can look very different. Why is the intrinsic value higher than the current share price? For Hewlett Packard Enterprise, there are three further elements you should consider:
- Risks: For example, we've discovered 4 warning signs for Hewlett Packard Enterprise that you should be aware of before investing here.
- Future Earnings: How does HPE's growth rate compare to its peers and the wider market? Dig deeper into the analyst consensus number for the upcoming years by interacting with our free analyst growth expectation chart.
- Other High Quality Alternatives: Do you like a good all-rounder? Explore our interactive list of high quality stocks to get an idea of what else is out there you may be missing!
PS. The Simply Wall St app conducts a discounted cash flow valuation for every stock on the NYSE every day. If you want to find the calculation for other stocks just search here.
Valuation is complex, but we're here to simplify it.
Discover if Hewlett Packard Enterprise might be undervalued or overvalued with our detailed analysis, featuring fair value estimates, potential risks, dividends, insider trades, and its financial condition.
Access Free AnalysisHave feedback on this article? Concerned about the content? Get in touch with us directly. Alternatively, email editorial-team (at) simplywallst.com.
This article by Simply Wall St is general in nature. We provide commentary based on historical data and analyst forecasts only using an unbiased methodology and our articles are not intended to be financial advice. It does not constitute a recommendation to buy or sell any stock, and does not take account of your objectives, or your financial situation. We aim to bring you long-term focused analysis driven by fundamental data. Note that our analysis may not factor in the latest price-sensitive company announcements or qualitative material. Simply Wall St has no position in any stocks mentioned.
About NYSE:HPE
Hewlett Packard Enterprise
Provides solutions that allow customers to capture, analyze, and act upon data seamlessly in the Americas, Europe, the Middle East, Africa, the Asia Pacific, and Japan.
Flawless balance sheet and undervalued.
Similar Companies
Market Insights

Community Narratives

